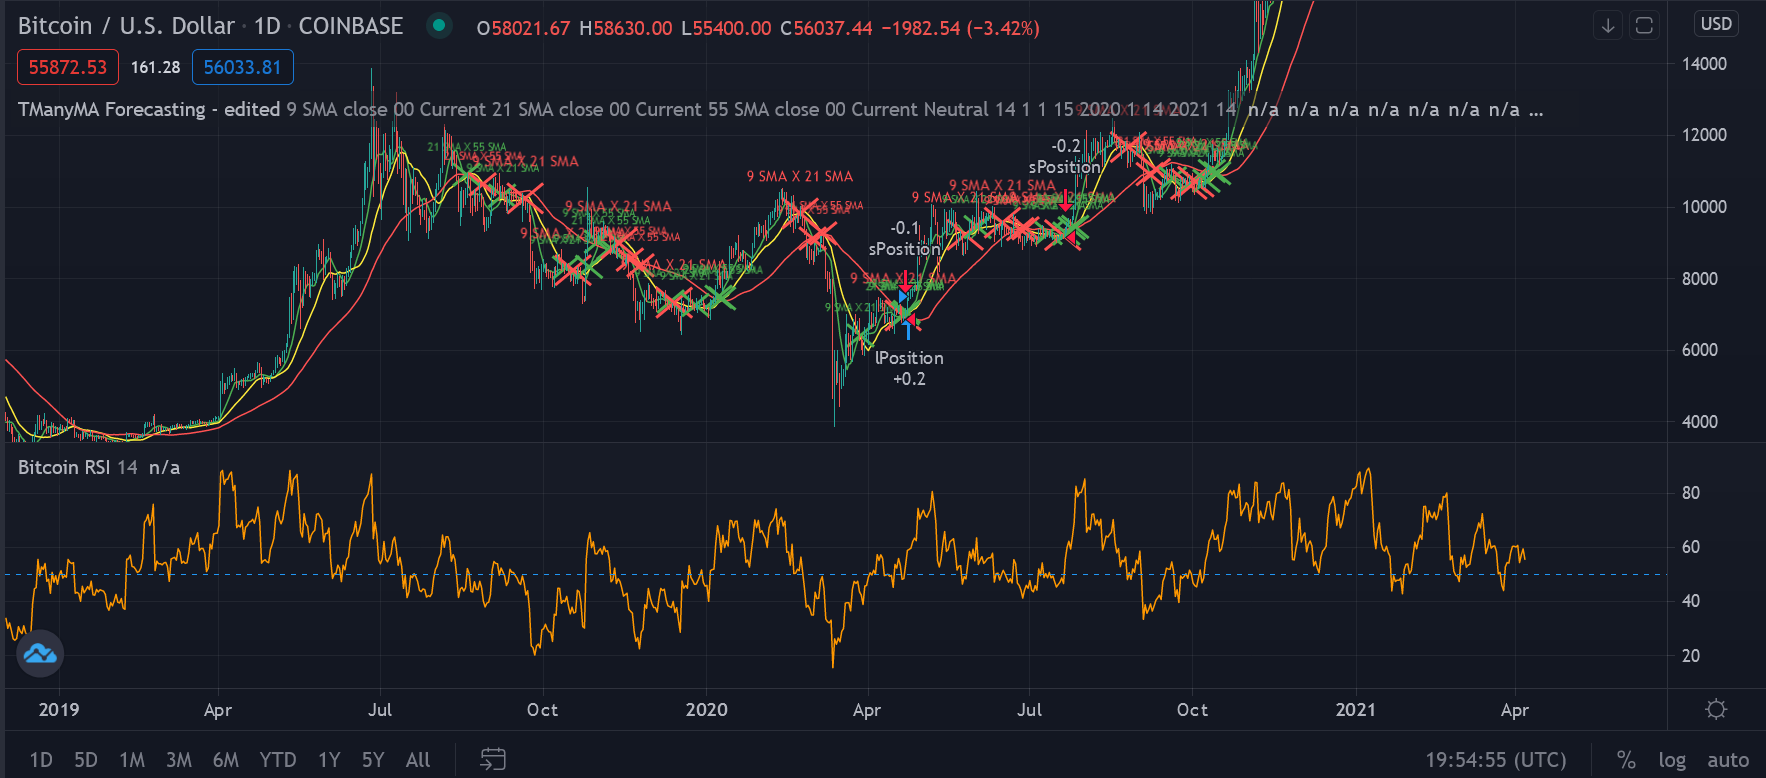
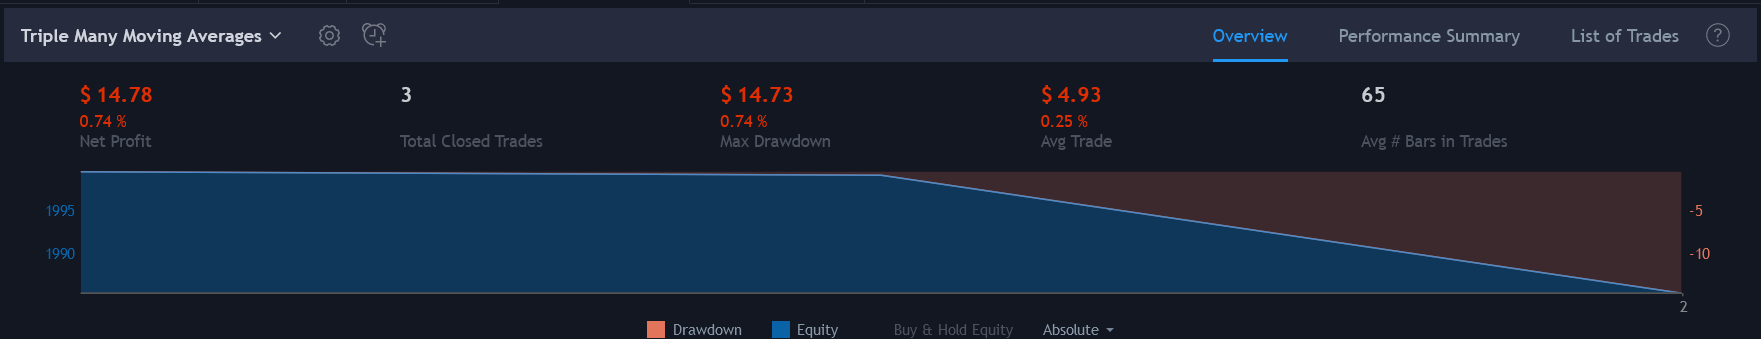
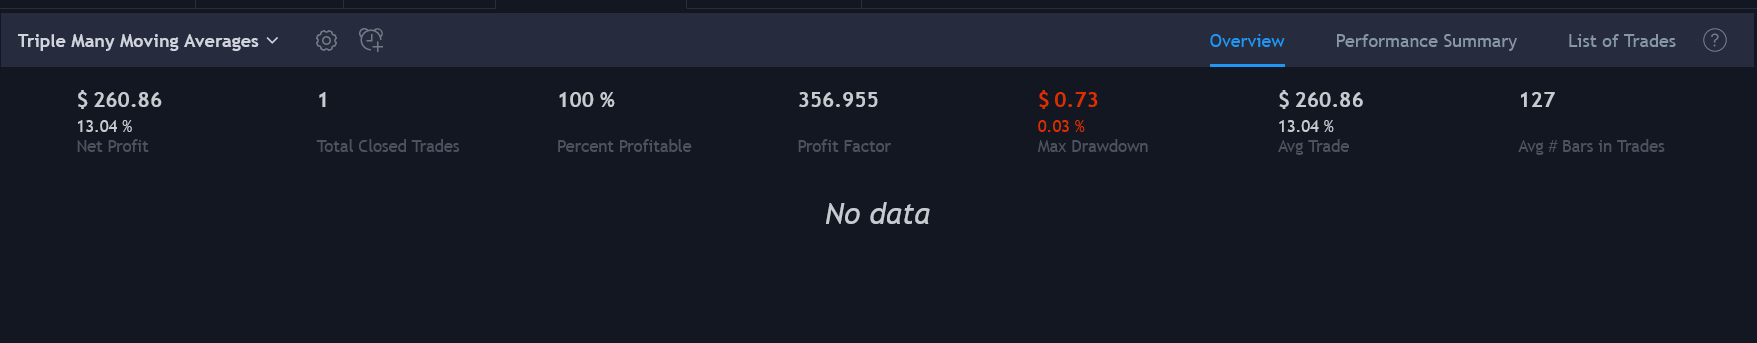
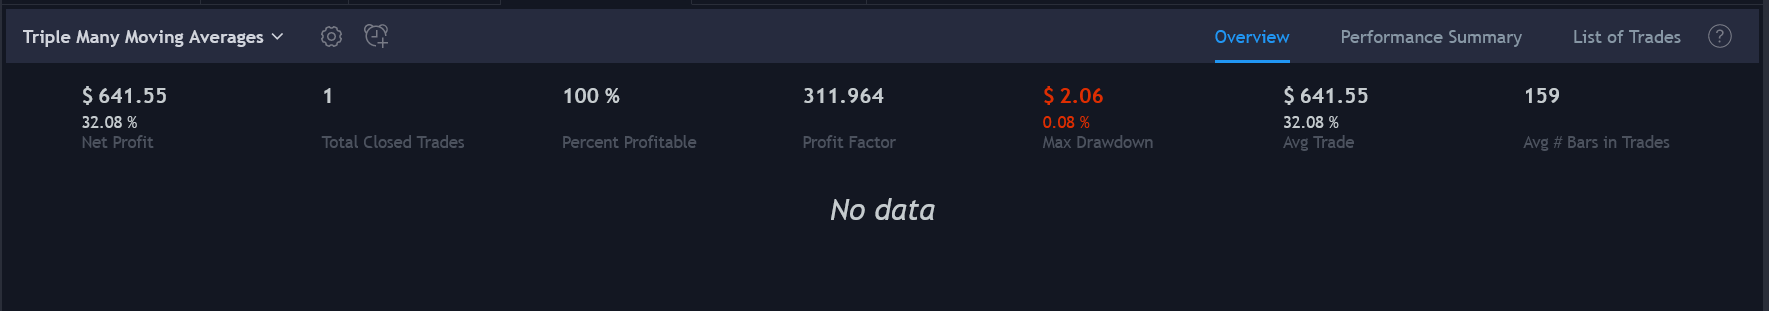
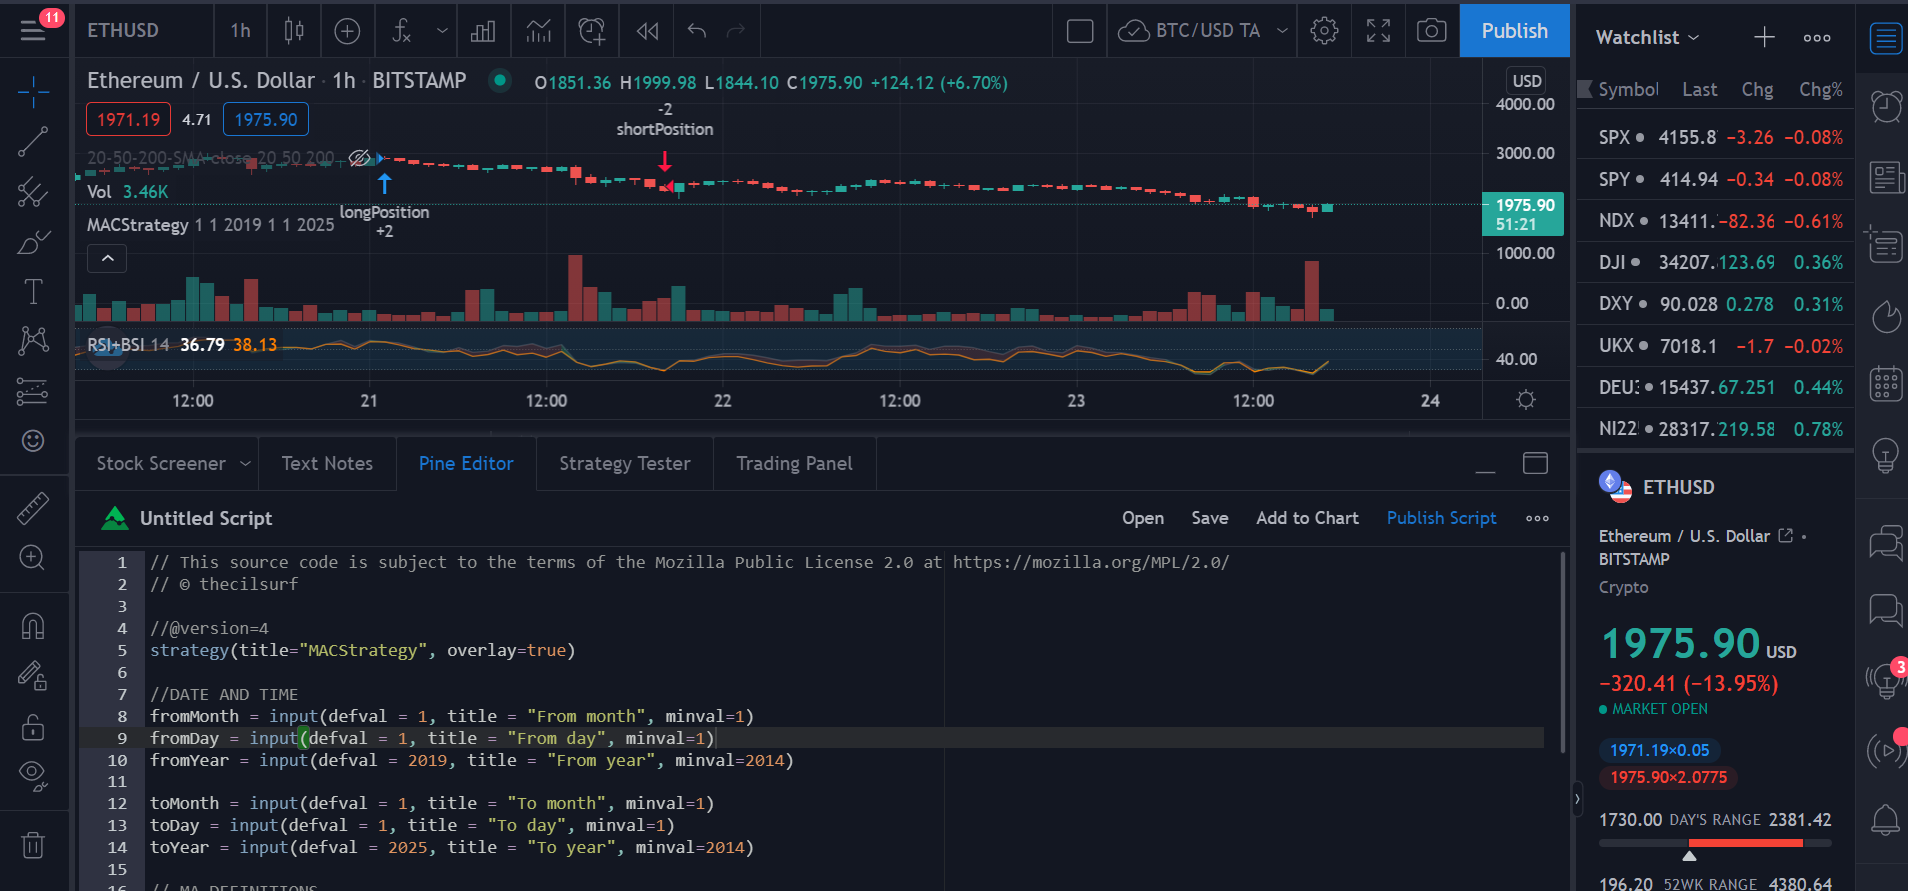
I was messing around with “super” long & short positions, but I’m not actually sure if that methodology makes sense. I’m sure I’ll find out once I’ve done some more trading research.
You can see my positions, and some ideas I was testing, at the bottom of the script.
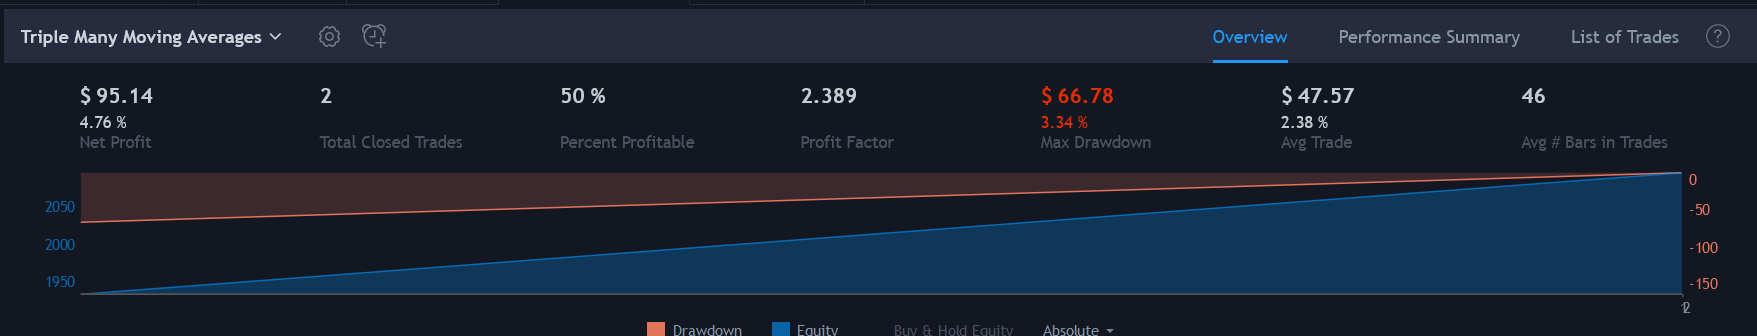
Triple Many Moving Averages (WARNING: LONG)
//@version=4
//
// Pine Script v4
// Original Author:
// @author BigBitsIO
// (Original) Script Library: https://www.tradingview.com/u/BigBitsIO/#published-scripts
//
// strategy(title, shorttitle, overlay, format, precision)
// https://www.tradingview.com/pine-script-docs/en/v4/annotations/study_annotation.html
strategy(shorttitle = "TManyMA Forecasting - edited", title="Triple Many Moving Averages", overlay=true, initial_capital=2000, commission_type=strategy.commission.percent, commission_value=0.2) // Improved with HMA, DEMA and TEMA and source options for MAs
// MA#Period is a variable used to store the indicator lookback period. In this case, from the input.
// input - https://www.tradingview.com/pine-script-docs/en/v4/annotations/Script_inputs.html
MA1Period = input(20, title="MA1 Period", minval=1, step=1)
MA1Type = input(title="MA1 Type", defval="SMA", options=["RMA", "SMA", "EMA", "WMA", "HMA", "DEMA", "TEMA", "VWMA"])
MA1Source = input(title="MA1 Source", type=input.source, defval=close)
MA1Resolution = input(title="MA1 Resolution", defval="00 Current", options=["00 Current", "01 1m", "02 3m", "03 5m", "04 15m", "05 30m", "06 45m", "07 1h", "08 2h", "09 3h", "10 4h", "11 1D", "12 1W", "13 1M"])
MA1Visible = input(title="MA1 Visible", type=input.bool, defval=true) // Will automatically hide crossBovers containing this MA
MA2Period = input(50, title="MA2 Period", minval=1, step=1)
MA2Type = input(title="MA2 Type", defval="SMA", options=["RMA", "SMA", "EMA", "WMA", "HMA", "DEMA", "TEMA", "VWMA"])
MA2Source = input(title="MA2 Source", type=input.source, defval=close)
MA2Resolution = input(title="MA2 Resolution", defval="00 Current", options=["00 Current", "01 1m", "02 3m", "03 5m", "04 15m", "05 30m", "06 45m", "07 1h", "08 2h", "09 3h", "10 4h", "11 1D", "12 1W", "13 1M"])
MA2Visible = input(title="MA2 Visible", type=input.bool, defval=true) // Will automatically hide crossovers containing this MA
MA3Period = input(100, title="MA3 Period", minval=1, step=1)
MA3Type = input(title="MA3 Type", defval="SMA", options=["RMA", "SMA", "EMA", "WMA", "HMA", "DEMA", "TEMA", "VWMA"])
MA3Source = input(title="MA3 Source", type=input.source, defval=close)
MA3Resolution = input(title="MA3 Resolution", defval="00 Current", options=["00 Current", "01 1m", "02 3m", "03 5m", "04 15m", "05 30m", "06 45m", "07 1h", "08 2h", "09 3h", "10 4h", "11 1D", "12 1W", "13 1M"])
MA3Visible = input(title="MA3 Visible", type=input.bool, defval=true) // Will automatically hide crossovers containing this MA
ShowCrosses = input(title="Show Crosses", type=input.bool, defval=true)
ForecastBias = input(title="Forecast Bias", defval="Neutral", options=["Neutral", "Bullish", "Bearish"])
ForecastBiasPeriod = input(14, title="Forecast Bias Period")
ForecastBiasMagnitude = input(1, title="Forecast Bias Magnitude", minval=0.25, maxval=20, step=0.25)
ShowForecasts = input(title="Show Forecasts", type=input.bool, defval=true)
// MA# is a variable used to store the actual moving average value.
// if statements - https://www.tradingview.com/pine-script-reference/#op_if
// MA functions - https://www.tradingview.com/pine-script-reference/ (must search for appropriate MA)
// custom functions in pine - https://www.tradingview.com/wiki/Declaring_Functions
ma(MAType, MASource, MAPeriod) =>
if MAType == "SMA"
sma(MASource, MAPeriod)
else
if MAType == "EMA"
ema(MASource, MAPeriod)
else
if MAType == "WMA"
wma(MASource, MAPeriod)
else
if MAType == "RMA"
rma(MASource, MAPeriod)
else
if MAType == "HMA"
wma(2*wma(MASource, MAPeriod/2)-wma(MASource, MAPeriod), round(sqrt(MAPeriod)))
else
if MAType == "DEMA"
e = ema(MASource, MAPeriod)
2 * e - ema(e, MAPeriod)
else
if MAType == "TEMA"
e = ema(MASource, MAPeriod)
3 * (e - ema(e, MAPeriod)) + ema(ema(e, MAPeriod), MAPeriod)
else
if MAType == "VWMA"
vwma(MASource, MAPeriod)
res(MAResolution) =>
if MAResolution == "00 Current"
timeframe.period
else
if MAResolution == "01 1m"
"1"
else
if MAResolution == "02 3m"
"3"
else
if MAResolution == "03 5m"
"5"
else
if MAResolution == "04 15m"
"15"
else
if MAResolution == "05 30m"
"30"
else
if MAResolution == "06 45m"
"45"
else
if MAResolution == "07 1h"
"60"
else
if MAResolution == "08 2h"
"120"
else
if MAResolution == "09 3h"
"180"
else
if MAResolution == "10 4h"
"240"
else
if MAResolution == "11 1D"
"1D"
else
if MAResolution == "12 1W"
"1W"
else
if MAResolution == "13 1M"
"1M"
MA1 = security(syminfo.tickerid, res(MA1Resolution), ma(MA1Type, MA1Source, MA1Period))
MA2 = security(syminfo.tickerid, res(MA2Resolution), ma(MA2Type, MA2Source, MA2Period))
MA3 = security(syminfo.tickerid, res(MA3Resolution), ma(MA3Type, MA3Source, MA3Period))
//MA4 = sma(security(syminfo.tickerid, "1D", close), 200)
//MA4 = security(syminfo.tickerid, '1D', ma(MA3Type, MA3Source, MA3Period))
//plot(MA4, color=color.orange, linewidth=4)
// Plotting crossover/unders for all combinations of crosses
// https://www.tradingview.com/pine-script-reference/v4/#fun_label%7Bdot%7Dnew
// X means "cross(over/under)"
// Green X = crossover (e.g. A crossover B)
// Red X = crossunder (e.g. A crossunder B)
if ShowCrosses and MA1Visible and MA2Visible and crossunder(MA1, MA2)
lun1 = label.new(bar_index, na, tostring(MA1Period)+' '+MA1Type+' X '+tostring(MA2Period)+' '+MA2Type,
color=color.red,
textcolor=color.red,
style=label.style_xcross, size=size.small)
label.set_y(lun1, MA1)
if ShowCrosses and MA1Visible and MA2Visible and crossover(MA1, MA2)
lup1 = label.new(bar_index, na, tostring(MA1Period)+' '+MA1Type+' X '+tostring(MA2Period)+' '+MA2Type,
color=color.green,
textcolor=color.green,
style=label.style_xcross, size=size.tiny)
label.set_y(lup1, MA1)
if ShowCrosses and MA1Visible and MA3Visible and crossunder(MA1, MA3)
lun2 = label.new(bar_index, na, tostring(MA1Period)+' '+MA1Type+' X '+tostring(MA3Period)+' '+MA3Type,
color=color.red,
textcolor=color.red,
style=label.style_xcross, size=size.tiny)
label.set_y(lun2, MA1)
if ShowCrosses and MA1Visible and MA3Visible and crossover(MA1, MA3)
lup2 = label.new(bar_index, na, tostring(MA1Period)+' '+MA1Type+' X '+tostring(MA3Period)+' '+MA3Type,
color=color.green,
textcolor=color.green,
style=label.style_xcross, size=size.tiny)
label.set_y(lup2, MA1)
if ShowCrosses and MA2Visible and MA3Visible and crossunder(MA2, MA3)
lun3 = label.new(bar_index, na, tostring(MA2Period)+' '+MA2Type+' X '+tostring(MA3Period)+' '+MA3Type,
color=color.red,
textcolor=color.red,
style=label.style_xcross, size=size.tiny)
label.set_y(lun3, MA2)
if ShowCrosses and MA2Visible and MA3Visible and crossover(MA2, MA3)
lup3 = label.new(bar_index, na, tostring(MA2Period)+' '+MA2Type+' X '+tostring(MA3Period)+' '+MA3Type,
color=color.green,
textcolor=color.green,
style=label.style_xcross, size=size.tiny)
label.set_y(lup3, MA2)
// plot - This will draw the information on the chart
// plot - https://www.tradingview.com/pine-script-docs/en/v4/annotations/plot_annotation.html
plot(MA1Visible ? MA1 : na, color=color.green, linewidth=1, title="MA1")
plot(MA2Visible ? MA2 : na, color=color.yellow, linewidth=1, title="MA2")
plot(MA3Visible ? MA3 : na, color=color.red, linewidth=1, title="MA3")
// Forecasting - forcasted prices are calculated using our MAType and MASource for the MAPeriod - the last X candles.
// it essentially replaces the oldest X candles, with the selected source * X candles
// Bias - We'll add an "adjustment" for each additional candle being forecasted based on ATR of the previous X candles
// custom functions in pine - https://www.tradingview.com/wiki/Declaring_Functions
bias(Bias, BiasPeriod) =>
if Bias == "Neutral"
0
else
if Bias == "Bullish"
(atr(BiasPeriod) * ForecastBiasMagnitude)
else
if Bias == "Bearish"
((atr(BiasPeriod) * ForecastBiasMagnitude) * -1) // multiplying by -1 to make it a negative, bearish bias
// Note - Can not show forecasts on different resolutions at the moment, x-axis is an issue
Bias = bias(ForecastBias, ForecastBiasPeriod) // 14 is default atr period
MA1Forecast1 = (security(syminfo.tickerid, res(MA1Resolution), ma(MA1Type, MA1Source, MA1Period - 1)) * (MA1Period - 1) + ((MA1Source * 1) + (Bias * 1))) / MA1Period
MA1Forecast2 = (security(syminfo.tickerid, res(MA1Resolution), ma(MA1Type, MA1Source, MA1Period - 2)) * (MA1Period - 2) + ((MA1Source * 2) + (Bias * 2))) / MA1Period
MA1Forecast3 = (security(syminfo.tickerid, res(MA1Resolution), ma(MA1Type, MA1Source, MA1Period - 3)) * (MA1Period - 3) + ((MA1Source * 3) + (Bias * 3))) / MA1Period
MA1Forecast4 = (security(syminfo.tickerid, res(MA1Resolution), ma(MA1Type, MA1Source, MA1Period - 4)) * (MA1Period - 4) + ((MA1Source * 4) + (Bias * 4))) / MA1Period
MA1Forecast5 = (security(syminfo.tickerid, res(MA1Resolution), ma(MA1Type, MA1Source, MA1Period - 5)) * (MA1Period - 5) + ((MA1Source * 5) + (Bias * 5))) / MA1Period
plot(MA1Resolution == "00 Current" and ShowForecasts and MA1Visible ? MA1Forecast1 : na, color=color.green, linewidth=1, style=plot.style_circles, title="Long 200 EMA Forecast 1", offset=1, show_last=1)
plot(MA1Resolution == "00 Current" and ShowForecasts and MA1Visible ? MA1Forecast2 : na, color=color.green, linewidth=1, style=plot.style_circles, title="Long 200 EMA Forecast 1", offset=2, show_last=1)
plot(MA1Resolution == "00 Current" and ShowForecasts and MA1Visible ? MA1Forecast3 : na, color=color.green, linewidth=1, style=plot.style_circles, title="Long 200 EMA Forecast 1", offset=3, show_last=1)
plot(MA1Resolution == "00 Current" and ShowForecasts and MA1Visible ? MA1Forecast4 : na, color=color.green, linewidth=1, style=plot.style_circles, title="Long 200 EMA Forecast 1", offset=4, show_last=1)
plot(MA1Resolution == "00 Current" and ShowForecasts and MA1Visible ? MA1Forecast5 : na, color=color.green, linewidth=1, style=plot.style_circles, title="Long 200 EMA Forecast 1", offset=5, show_last=1)
MA2Forecast1 = (security(syminfo.tickerid, res(MA2Resolution), ma(MA2Type, MA2Source, MA2Period - 1)) * (MA2Period - 1) + ((MA1Source * 1) + (Bias * 1))) / MA2Period
MA2Forecast2 = (security(syminfo.tickerid, res(MA2Resolution), ma(MA2Type, MA2Source, MA2Period - 2)) * (MA2Period - 2) + ((MA1Source * 2) + (Bias * 2))) / MA2Period
MA2Forecast3 = (security(syminfo.tickerid, res(MA2Resolution), ma(MA2Type, MA2Source, MA2Period - 3)) * (MA2Period - 3) + ((MA1Source * 3) + (Bias * 3))) / MA2Period
MA2Forecast4 = (security(syminfo.tickerid, res(MA2Resolution), ma(MA2Type, MA2Source, MA2Period - 4)) * (MA2Period - 4) + ((MA1Source * 4) + (Bias * 4))) / MA2Period
MA2Forecast5 = (security(syminfo.tickerid, res(MA2Resolution), ma(MA2Type, MA2Source, MA2Period - 5)) * (MA2Period - 5) + ((MA1Source * 5) + (Bias * 5))) / MA2Period
plot(MA2Resolution == "00 Current" and ShowForecasts and MA2Visible ? MA2Forecast1 : na, color=color.yellow, linewidth=1, style=plot.style_circles, title="Long 200 EMA Forecast 1", offset=1, show_last=1)
plot(MA2Resolution == "00 Current" and ShowForecasts and MA2Visible ? MA2Forecast2 : na, color=color.yellow, linewidth=1, style=plot.style_circles, title="Long 200 EMA Forecast 1", offset=2, show_last=1)
plot(MA2Resolution == "00 Current" and ShowForecasts and MA2Visible ? MA2Forecast3 : na, color=color.yellow, linewidth=1, style=plot.style_circles, title="Long 200 EMA Forecast 1", offset=3, show_last=1)
plot(MA2Resolution == "00 Current" and ShowForecasts and MA2Visible ? MA2Forecast4 : na, color=color.yellow, linewidth=1, style=plot.style_circles, title="Long 200 EMA Forecast 1", offset=4, show_last=1)
plot(MA2Resolution == "00 Current" and ShowForecasts and MA2Visible ? MA2Forecast5 : na, color=color.yellow, linewidth=1, style=plot.style_circles, title="Long 200 EMA Forecast 1", offset=5, show_last=1)
MA3Forecast1 = (security(syminfo.tickerid, res(MA3Resolution), ma(MA3Type, MA3Source, MA3Period - 1)) * (MA3Period - 1) + ((MA1Source * 1) + (Bias * 1))) / MA3Period
MA3Forecast2 = (security(syminfo.tickerid, res(MA3Resolution), ma(MA3Type, MA3Source, MA3Period - 2)) * (MA3Period - 2) + ((MA1Source * 2) + (Bias * 2))) / MA3Period
MA3Forecast3 = (security(syminfo.tickerid, res(MA3Resolution), ma(MA3Type, MA3Source, MA3Period - 3)) * (MA3Period - 3) + ((MA1Source * 3) + (Bias * 3))) / MA3Period
MA3Forecast4 = (security(syminfo.tickerid, res(MA3Resolution), ma(MA3Type, MA3Source, MA3Period - 4)) * (MA3Period - 4) + ((MA1Source * 4) + (Bias * 4))) / MA3Period
MA3Forecast5 = (security(syminfo.tickerid, res(MA3Resolution), ma(MA3Type, MA3Source, MA3Period - 5)) * (MA3Period - 5) + ((MA1Source * 5) + (Bias * 5))) / MA3Period
plot(MA3Resolution == "00 Current" and ShowForecasts and MA3Visible ? MA3Forecast1 : na, color=color.red, linewidth=1, style=plot.style_circles, title="Long 200 EMA Forecast 1", offset=1, show_last=1)
plot(MA3Resolution == "00 Current" and ShowForecasts and MA3Visible ? MA3Forecast2 : na, color=color.red, linewidth=1, style=plot.style_circles, title="Long 200 EMA Forecast 1", offset=2, show_last=1)
plot(MA3Resolution == "00 Current" and ShowForecasts and MA3Visible ? MA3Forecast3 : na, color=color.red, linewidth=1, style=plot.style_circles, title="Long 200 EMA Forecast 1", offset=3, show_last=1)
plot(MA3Resolution == "00 Current" and ShowForecasts and MA3Visible ? MA3Forecast4 : na, color=color.red, linewidth=1, style=plot.style_circles, title="Long 200 EMA Forecast 1", offset=4, show_last=1)
plot(MA3Resolution == "00 Current" and ShowForecasts and MA3Visible ? MA3Forecast5 : na, color=color.red, linewidth=1, style=plot.style_circles, title="Long 200 EMA Forecast 1", offset=5, show_last=1)
//--------------------------------------------------------------------------------------
//independent variables; change these to change the strategy
// MA1Period (default: 20)
// MA2Period (default: 50)
// MA3Period (default: 100)
//date and time
fromMonth = input(defval=1, title="from month", minval=1)
fromDay = input(defval=15, title="from day", minval=1)
fromYear = input(defval=2015, title="from year", minval=2014)
toMonth = input(defval=1, title="to month", minval=1)
toDay = input(defval=15, title="to day", minval=1)
toYear = input(defval=2021, title="to year", minval=2014)
//definitions
shortMa = sma(close, MA1Period)
mediumMa = sma(close, MA2Period)
longMa = sma(close, MA3Period)
period = input(14)
r = rsi(close, period)
//logic
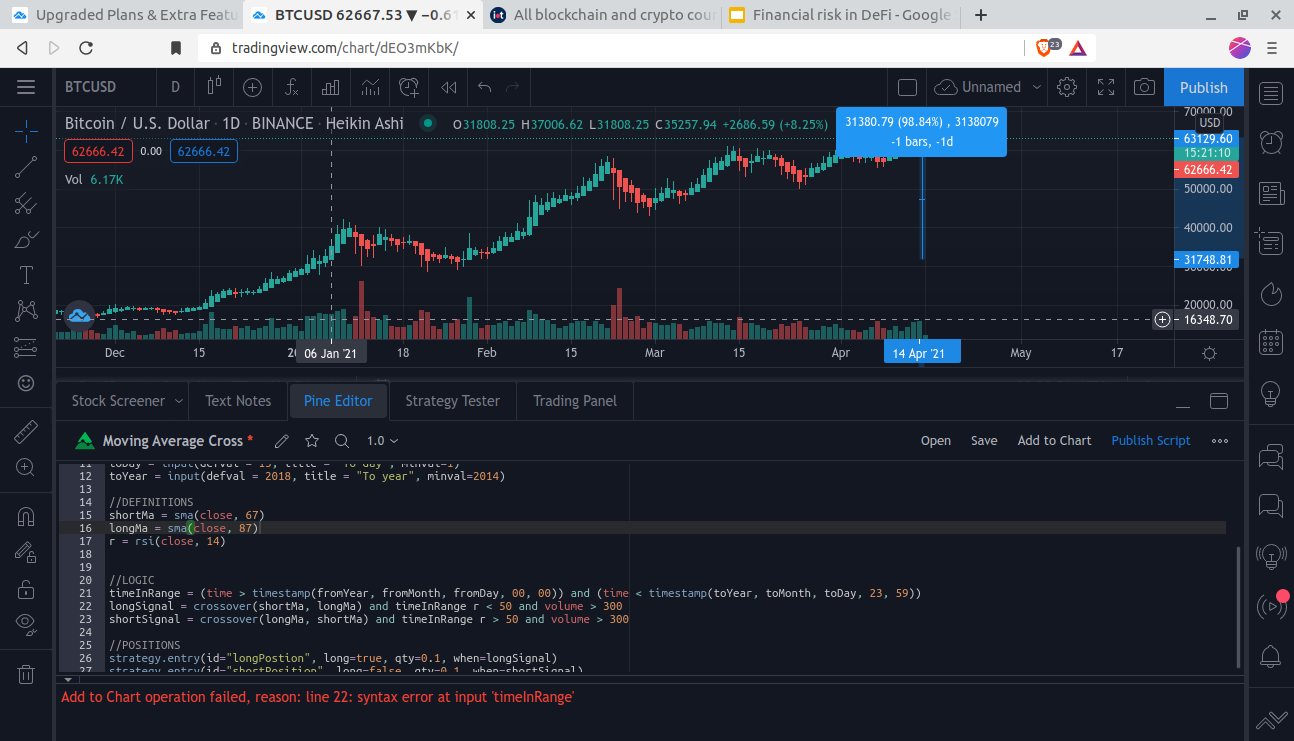
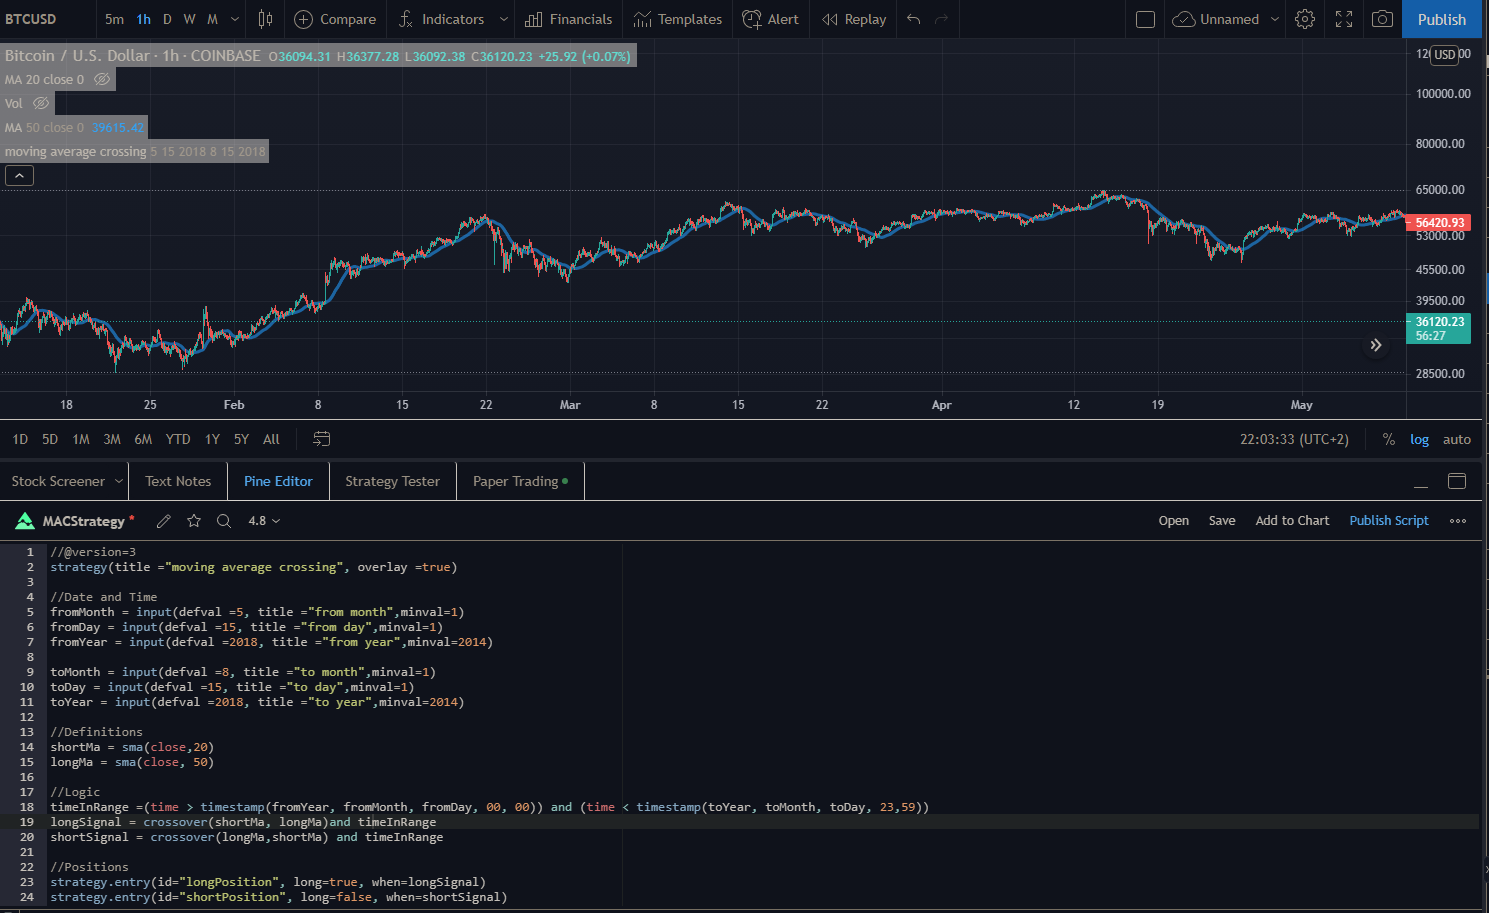
timeInRange = (time > timestamp(fromYear, fromMonth, fromDay, 00, 00)) and (time < timestamp(toYear, toMonth, toDay, 23, 59))
// l = long, xl = super long, xxl = super super long
//xxlSignal = crossover(shortMa, longMa) and timeInRange and r < 50
//xlSignal = crossover(mediumMa, longMa) and timeInRange and r < 50
lSignal = timeInRange and crossover(shortMa, mediumMa) and shortMa > longMa and r < 70
//s = short, xs = super short, xxs = super super short
sSignal = timeInRange and crossover(mediumMa, shortMa) and longMa > shortMa and r > 30
//xsSignal = crossover(mediumMa, shortMa) and timeInRange and r > 50
//xxsSignal = crossover(longMa, shortMa) and timeInRange and r > 50
//positions
//strategy.entry(id="xxlPosition", long=true, qty=0.1, when=xxlSignal)
//strategy.entry(id="xlPosition", long=true, qty=0.1, when=xlSignal)
strategy.entry(id="lPosition", long=true, qty=0.1, when=lSignal)
//strategy.entry(id="testPosition", long=true, qty=0.1, when=shortMa > longMa and timeInRange)
strategy.entry(id="sPosition", long=false, qty=0.1, when=sSignal)
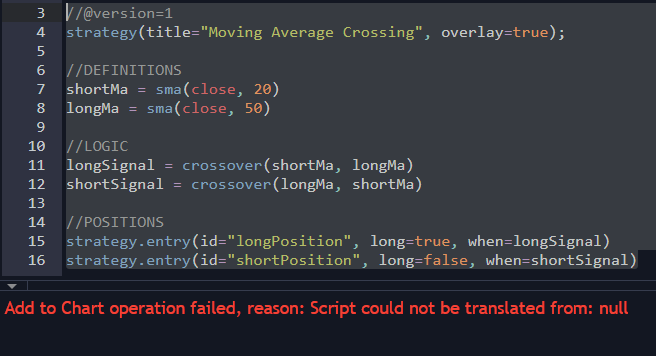
I would post it on github but I don’t know if it’s appropriate for github and it’s mostly not my code, even though the code is open source.


