Building a Strategy Discussion

Running into issues y’all!

So, I’m fairly certain I got the right code:

// @version=3
strategy(title = "MA Cross", overlay=true, initial_capital=2000, commission_type="strategy.commission.percent", commission_value=0.2)

// DATE AND TIME
fromMonth = input(defval=5, title = "From month", minval=1)
fromDay = input(defval=15, title = "From day", minval=1)
fromYear = input(defval=2018, title = "From year", minval=2014)

toMonth = input(defval=8, title = "To month", minval=1)
toDay = input(defval=15, title = "To day", minval=1)
toYear = input(defval=2018, title = "To year", minval=2014)

// VARS
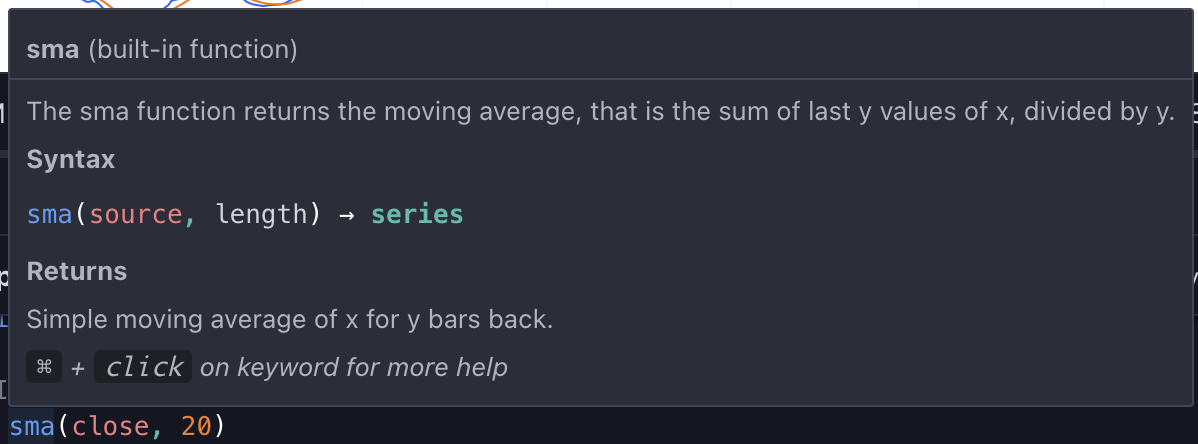
shortMA = sma(close, 20)
longMA = sma(close, 50)

// LOGIC
timeInRange = (time > timestamp(fromYear, fromMonth, fromDay, 00, 00)) and (time < timestamp(toYear, toMonth, toYear, 23, 59))
longSignal = crossover(shortMA, longMA) and timeInRange
shortSignal = crossover(longMA, shortMA) and timeInRange

// POSITIONS
strategy.entry(id="longPosition", long=true,qty=0.1, when=longSignal)
strategy.entry(id="shortPosition", long=false, qty=0.1, when=shortSignal)

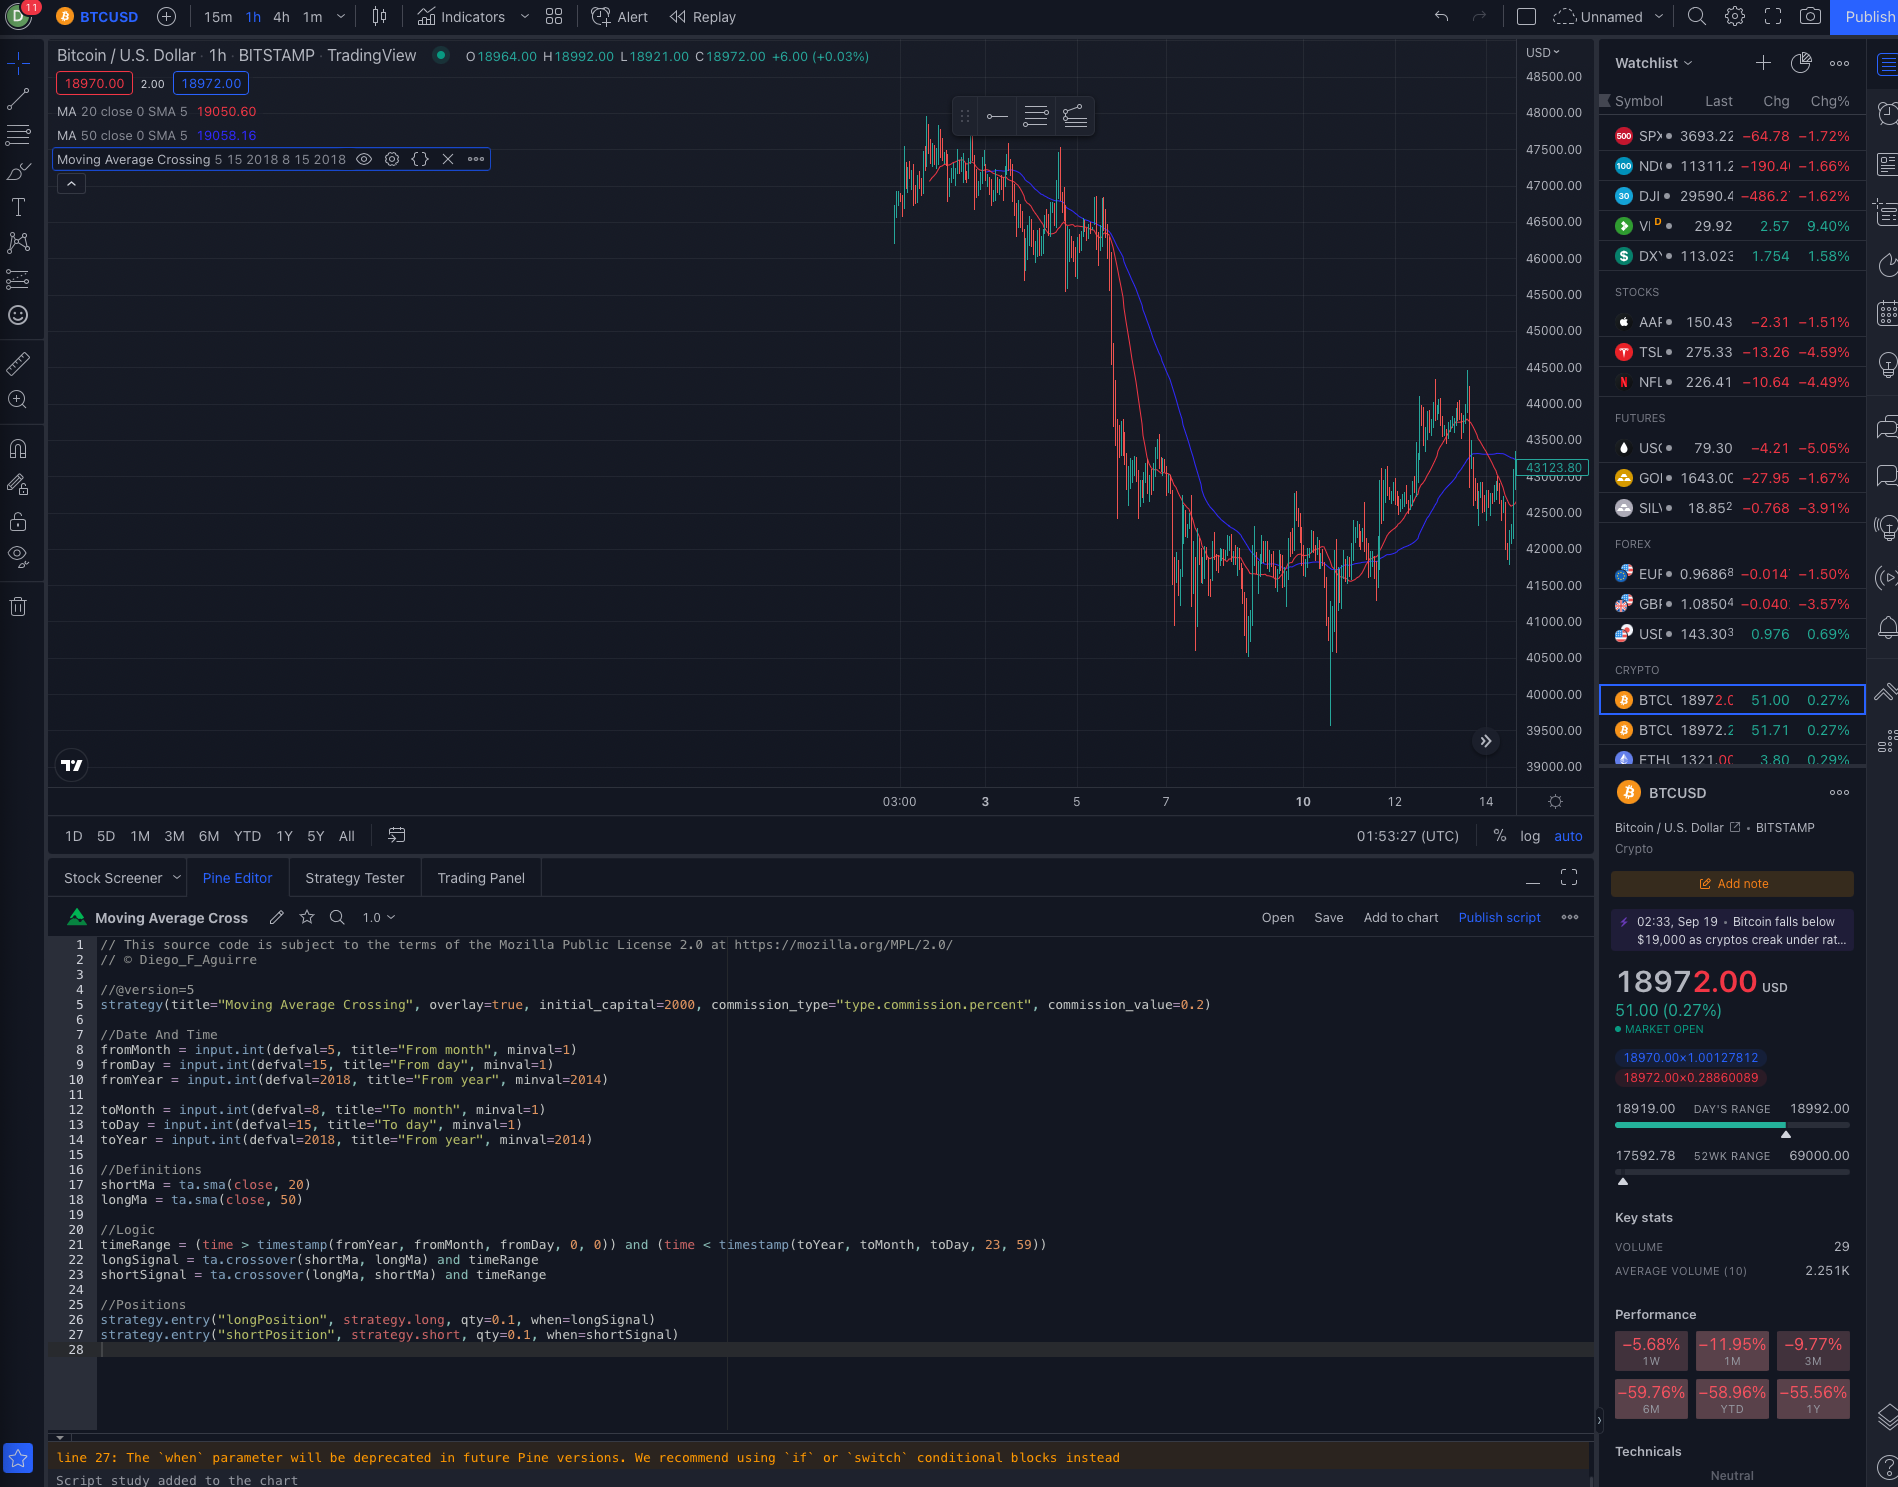
When I “Add to Chart” I can see it, BUT, I only get 19 trades total and it runs until now-ish (2021).

Clearly something is not right, so what am I doing wrong?

1 Like

OMG, I’m THAT guy… replying to my own post… I think I figured out why it’s not matching… Filip’s chart is on 1 hour for 2018 and being in 2021 TW simply won’t go back that far for 1 hour, it will on 1 day, but then the data is not matching… but maybe I’m wrong :man_shrugging:

2 Likes

hello sir @filip I’m thinking about of a strategy that is more on hodling where I will sell only if there’s an obvious dump in the market and buyback again if the signals for buying are met. I’m not comfortable with futures at the moment so I’m planning of doing this on spot.

What do you think?

Hello,

As soon as add the backtesting code in part 3 I lose all content. Nothing adds to chart , all position markers gone. Can anyone help?, Thank you.

//@version=3

strategy(title = "Moving Average Crossing", overlay = true, initial_capital = 2000, commission_type="Strategy.commission.percent", commission_value = 0.2)

//DATE AND TIME
fromMonth = input(defval=5, title = "From month", minval=1)
fromDay = input(defval=15, title = "From day", minval=1)
fromYear = input(defval=2018, title = "From year", minval=2014)

toMonth = input(defval=8, title = "To month", minval=1)
toDay = input(defval=15, title = "To day", minval=1)
toYear = input(defval=2018, title = "To year", minval=2014)


//DEFINITIONS
shortMa = sma(close,20)
longMa = sma(close,50)


//LOGIC
timeInRange = (time > timestamp(fromYear,fromMonth, fromDay, 00, 00)) and (time < timestamp(toYear, toMonth, toDay, 23, 59))
longSignal = crossover(shortMa,longMa) and timeInRange
shortSignal= crossover(longMa, shortMa) and timeInRange

//POSITIONS
strategy.entry(id = "longPosition", long=true, qty=0.1,  when=longSignal)
strategy.entry(id = "shortPosition", long=false, qty=0.1,  when=shortSignal)


Hi @filip or anyone that can help!

I don’t know why but after I printed on my trading view print script the example. When I ran it it gives me the following error.

Add to Chart operation failed, reason: line 11: Could not find function or function reference ‘sma’.

Line 11 would be thhis one:
shortMa = sma(close, 20)

Please help on the example before also had error. I’m not able to run nothing yet.

Thank you…
Bellow is the full Script of the example!

//@version=5
indicator(“My Script”)
plot(close)

strategy(title=“Moving Average Crossing”, overlay=true)

//DEFINITION
shortMa = sma(close, 20)
longMa = sma(close, 50)

//LOGIC
longSignal = crossover(shortMa,longMa)
shortSignal = crossover(longMa,shortMa)

//POSITION
strategy.entry(id=“longPosition”, long=true, when=longSignal)
strategy.entry(id=“shortPosition”, long=false, when=shortSignal)

Hey @elconocrypto, hope you are well.

Could you please share your contract code in the following way so we can help you review the error?

Carlos Z

thank you @thecil

indicator("My Script")
plot(close)

strategy(title="Moving Average Crossing", overlay=true)

//DATE AND TIME
fromMonth = input.int(defval=1, title = "From month", minval=1)
fromDay = input.int(defval=1, title = "From day", minval=1)
fromYear = input.int(defval=2019, title = "From year", minval=2014)

toMonth = input.int(defval=1, title = "To month", minval=1)
toDay = input.int(defval=1, title = "To day", minval=1)
toYear = input.int(defval=2019, title = "To year", minval=2014)


//DEFINITION
shortMa = sma(close, 20)
longMa = sma(close, 50)

//LOGIC
timeInRange = (time > timestam(fromyear, fromMonth,fromDay,00,00)) and (time < timestamp(toYear, toMonth, ToDay, 23, 59))
longSignal = crossover(shortMa,longMa) and timeinRange
shortSignal = crossover(longMa,shortMa) and timeinRange


//POSITION
strategy.entry(id="longPosition", long=true, when=longSignal)
strategy.entry(id="shortPosition", long=false, when=shortSignal)

You have some few typoerrors in your code, mainly incorrect variables names.

This is your code but i just fix those typo errors, compare yours with mine, is the same but just corrected in the variables name (like toDay instead of ToDay)

strategy(title="Moving Average Crossing", overlay=true)
plot(close)

//DATE AND TIME
fromMonth = input(defval=1, title = "From month", minval=1)
fromDay = input(defval=1, title = "From day", minval=1)
fromYear = input(defval=2019, title = "From year", minval=2014)
toMonth = input(defval=1, title = "To month", minval=1)
toDay = input(defval=1, title = "To day", minval=1)
toYear = input(defval=2019, title = "To year", minval=2014)

//DEFINITION
shortMa = sma(close, 20)
longMa = sma(close, 50)

//LOGIC
timeInRange = (time > timestamp(fromYear, fromMonth,fromDay,00,00)) and (time < timestamp(toYear, toMonth, toDay, 23, 59))
longSignal = crossover(shortMa,longMa) and timeInRange
shortSignal = crossover(longMa,shortMa) and timeInRange


//POSITION
strategy.entry(id="longPosition", long=true, when=longSignal)
strategy.entry(id="shortPosition", long=false, when=shortSignal)

Carlos Z

Hi, one thing is confusing: I use the code it works. The results change depending on the time frame I view (1 hour, 1 day, 1 month, 5 minutes, etc.). When I set the SMA(close, 20) --> the 20 in the brackets is it connected to the time frame that is opened in tradingview or is it general for example 20 days? (For example I view the chart with daily candles then it is 20 days and if I view the chart with minute candles it is 20 minutes?)

1 Like

from video: backtesting part 3

i.e. you have to sit here and play with all the parameters, but NO NO NO!!! this is a job for a programmer! i don’t know the formal name, but can anyone help me out here?
all we’re trying to do is iterate over parameters in a metric space (and there are efficient ways of doing this to find local minima/maxima so that you don’t even need to try ALL parameters…); it absolutely lends itself to a programming solution.

has anyone tried or at least heard of this???

@thecil, save us!
haha thanks for any input…

Hello Filip.
I have problem with Model sma ,becouse when i write it in traidingiew i get answer :
"Could not find function reference ‘sma’.
Please help,tnx

1 Like

Hey @Zenkic, hope you are well.

Please share your code in the following way so I can review it :nerd_face:

https://academy.moralis.io/lessons/how-to-post-code-in-the-forum

Carlos Z

Hello,i have resolved it,thanks

1 Like

Hi everyone,

I started trying to run filip’s code which is a good thing as it made me realise some renaming of functions or arguments have been done since the version of pine script has changed (adding ta. to technical analysis functions, input.int to be used it seems, etc.)
Then, I am not saying I am particularly creative, I tried the crossover ema 50/100, which gives good results on some datasets of 6 months but not all (not surprising 2021 datasets give better results, not true for first 4 months 2022)- I am also trying to play with the timeframe, I assume the code takes the timeframe chosen in the view and calculates the ema(s) based on the timeframe chosen, so I guess the same code gives a different result depending on the timeframe of the view - I also assume there must be a way to specify the timeframe directly in the code - I am still trying but anyway here is the code to at least share what I tried to apply so far -:

//@version=5

strategy(title="Moralis course",overlay=true,initial_capital=2000, commission_type= strategy.commission.percent, commission_value=0.2)

//Date and time
fromMonth= input.int(defval=1, title = "From month", minval=1)
fromDay= input.int(defval=1, title= "From day", minval=1)
fromYear= input.int(defval=2019, title = "From year", minval=2014)

toMonth= input.int(defval=1, title = "To month", minval=1)
toDay= input.int(defval=1, title= "To day", minval=1)
toYear= input.int(defval=2025, title = "To year", minval=2014)


//Definitions
shortMa = ta.ema(close,50)
longMa = ta.ema(close,100)


//Logic
timeinRange=(time>timestamp(fromYear, fromMonth,fromDay,00,00)) and (time<timestamp(toYear, toMonth,toDay,00,00))
longSignal = ta.crossover(shortMa,longMa) and timeinRange
shortSignal = ta.crossover(longMa,shortMa)and timeinRange

//Positions
strategy.entry("longPosition", strategy.long, when=longSignal)
strategy.entry("shortPosition", strategy.short, when=shortSignal)

I’m having the same issue by any chance do you remember what you did to resolve it?

Feel silly, I’ve somehow can’t seem to access data on the chart prior to 2022.

I think my code looks fine but I can’t test it because I can’t reach 2018 data. Wondering if anyone knows if this is because I’m an unpaid user on TradingView or I inadvertently turned off some kind of setting.

My code below of what I’m trying to test. If anyone has any thoughts it would be much appreciated :pray:

strategy(title="Moving Average Crossing", overlay=true, initial_capital=2000, commission_type="type.commission.percent", commission_value=0.2)

//Date And Time
fromMonth = input.int(defval=5, title="From month", minval=1)
fromDay = input.int(defval=15, title="From day", minval=1)
fromYear = input.int(defval=2018, title="From year", minval=2014)

toMonth = input.int(defval=8, title="To month", minval=1)
toDay = input.int(defval=15, title="To day", minval=1)
toYear = input.int(defval=2018, title="From year", minval=2014)

//Definitions
shortMa = ta.sma(close, 20)
longMa = ta.sma(close, 50)

//Logic
timeRange = (time > timestamp(fromYear, fromMonth, fromDay, 0, 0)) and (time < timestamp(toYear, toMonth, toDay, 23, 59)) 
longSignal = ta.crossover(shortMa, longMa) and timeRange
shortSignal = ta.crossover(longMa, shortMa) and timeRange

//Positions
strategy.entry("longPosition", strategy.long, qty=0.1, when=longSignal)
strategy.entry("shortPosition", strategy.short, qty=0.1, when=shortSignal)

Seems like this might be somewhat of a known issue.

Apparently there is a workaround to get that additional data on the 1 hour chart but it involves using the Replay feature which is not available to free users.

https://www.youtube.com/watch?v=lj56LlGPBkY&t=26s

Could not find function or function reference ‘sma’.

i keep getting this error. plz help

@JohnVersus - I keep getting this error:
"Could not find function or function reference ‘sma’.

is there a new command now? Pineeditor is not recognizing these functions.

Hi @Khudeja

I could see it is still a valid function as per the editor.

Maybe try refreshing the page.