Building a Strategy Discussion

@filip

Ive been doing a fair amount of thought on this and this is what ive come up with
(however im not sure why you have price[1] and price [0])

Wanting to take a buy position when the 2 MA’s have crossed…

ma[0] = Daily moving average of say 10
ma[1] = Daily moving average of 30
price > ma[0] && price > ma[1]
Buy
Else - Hold

I think i can workout how to do that…

However what i cant seem to workout is how to do a trailing stop or even a stoploss based on the buy price.
I want to also be able to do a take profit at x amount of points… But haven’t been able to get that to work either.

Are you able to shed some light on what i can do?

I’ve read the API Data on Gemini and Cryptocompare back to front and cant find anything that will work.

Below is the last thing i tried to get it to take a profit, but that didnt work.

    indicators.hourlyMovingAverage("BTC","USD",1,function(ma){

      exchange.bitcoinPrice()
      .then(response => {

        var price = response.last;

        console.log("MA: ", ma);
        console.log("Price ", price);

        if(price > ma && !hasPosition){

          console.log("BUY!")
          exchange.marketBuyBitcoin()
          .then(response=>{
            console.log("Buy succsesful")
            hasPosition = true;

            setTimeout(strategy, 1000);
  // **** ALWAYS make sure setTimeout is within the function otherwise it wont work properly *****
          })
          .catch(error => console.error)

        }

        else if (price > ma && hasPosition && sell100higher){

          function sell100higher(){
            exchange.bitcoinPrice() += 10
          };


          console.log("SELLL!")
          exchange.marketSellBitcoin()
          .then(response=>{
            console.log("Sell succsesful")
            hasPosition = false;

            setTimeout(strategy, 1000);
// **** ALWAYS make sure setTimeout is within the function otherwise it wont work properly *****
          })
          .catch(error => console.error)

        }

Hi Filip. Thanks again for the great course!
Just a little practical comment, maybe try to put the recording volume a bit higher as I am listening at max volume in public transports and can not hear everything properly as the volume feels too low. Or maybe I’m just getting deaf lol

3 Likes

What is is that doesn’t work? That could should simply buy once the price is higher than the ma.

Hey guys!

I was looking at the source code of Pivot Reversal Strategy that is available on Tradingview. I have pasted it here:

//@version=4
strategy("Pivot Reversal Strategy", overlay=true)

leftBars = input(4)
rightBars = input(2)

swh = pivothigh(leftBars, rightBars)
swl = pivotlow(leftBars, rightBars)

swh_cond = not na(swh)

hprice = 0.0
hprice := swh_cond ? swh : hprice[1]

le = false
le := swh_cond ? true : (le[1] and high > hprice ? false : le[1])

if (le)
    strategy.entry("PivRevLE", strategy.long, comment="PivRevLE", stop=hprice + syminfo.mintick)

swl_cond = not na(swl)

lprice = 0.0
lprice := swl_cond ? swl : lprice[1]


se = false
se := swl_cond ? true : (se[1] and low < lprice ? false : se[1])

if (se)
    strategy.entry("PivRevSE", strategy.short, comment="PivRevSE", stop=lprice - syminfo.mintick)

//plot(strategy.equity, title="equity", color=color.red, linewidth=2, style=plot.style_areabr)

I was trying to go through the code to understand a bit more of what is going on in the strategy. However, I cannot find how ‘pivothigh’ and ‘pivotlow’ are being calculated anywhere in the pinescript documentation as well as through some searching around on the internet.

If I treat that as a black box calculation, then as far as I understand it. The strategy is entering a position when the pivot value is found (not NA) or by comparing the previous pivot value in the series(if there is one) to the current high.

Does anyone know more about this strategy and can clarify this?
It looks promising so just looking to understand it better so I can adapt it with my own tweaks

You can read more about pivot points and how they are calculated here: https://www.investopedia.com/terms/p/pivotpoint.asp

I will read through the strategy and get back to you on that.

Thanks for the resource Filip! I also came across a video on Youtube that explained the concept of pivot points. But I still don’t understand the pivothigh and pivotlow being calculated here in this strategy. Don’t know if I am missing some crucial piece to understanding this. Looking forward to hearing back from you!

I’m not sure exactly what you are asking. I don’t know the inner workings of the function, since it’s a proprietary function from tradingview. But the pivothigh function returns the price of the pivothigh if there is a pivot high using rightBars and leftBars. Default is leftBars 4 and rightBars 2. That means that in order for a candle to be a pivot point we need to take into account 4 bars back (left) and 2 bars ahead (right). That of course means that finding a pivot point will always be delayed by 2 bars.

Then, if there is a pivot point, the strategy will place a stop order at the pivot point price level + 1 tick. That means that the order will be placed right above or below the pivot points, depending if it is a high point or a low point. So whenever the price crosses above a pivot high point we go long, and whenever the price go below a pivot low point we go short.

That is interesting. That was one of the parts that was confusing me, regarding the leftBars and rightBars. Now I understand that it is calculating in a delayed manner.

But I still don’t understand the pivothigh and pivotlow. In this article that you sent, https://www.investopedia.com/terms/p/pivotpoint.asp, it discusses a single pivot point, then R1, R2, S1 and S2. So I’m just unsure what the pivothigh and low are. Perhaps R1 and S1?

Like you said it is a propriety function, so I may have to reach out to tradingview to find the meaning of this (assuming they will answer). But in order to code this strategy in Javascript or a similar language I would need to know the calculation being done by these functions.

Thank you for the reply!

Sorry, the investopedia link I shared was actually not the correct type of pivot point. In trading view, they refer to pivot high and pivot low, which is not the same as a pivot point. I took a quick look and assumed so.

Now, pivot high and pivot low is something else. What it really means is this:

Pivots are a turning point in price where you have three candles that exhibit a particular price pattern. A pivot high is a particular pattern where you have a candle that has made a high while the candle just before and after it would have both lower highs and lower lows than the middle candle. A pivot low would be a low surrounded by candles that made higher highs.

This is taken from here: https://www.tradingacademy.com/lessons/article/pivoting-towards-trading-success/.

So pivothigh is a candle that has all surrounding candles lower than itself. The opposite would be pivotlow. You can see illustrations of this in the link above.

So when we specify leftbars and rightbars in tradingview, we are specifying how many candles should be taken into account to the left and to the right.

Hey @filip, I wasn’t able to find a similar question that you or Ivan might of answered. But how do you account for different types of market cycles? Is it better to make one strategy or have multiple depending on the market cycle?

Good question! In theory, there is nothing wrong with having different strategies or algo’s for different market cycles. But in practice it becomes a little bit more difficult. How would you define when to deploy which algo or use a certain strategy? How would you determine if it’s a bull/bear market?

You would need some conditions to define that, so that you’re not only relying on your emotions. And if you need conditions to determine which strategy to use, you could build those conditions into your strategy any way. You get my point?

Let’s say you have two strategies, one for bull and one for bear conditions. And let’s say you determine that by looking at the 200d MA. You could put all of that into code any way, so it would become one algo.

So in short, the strategy can be different yes, but it’s important to have clearly defined conditions on when the strategies apply.

Hi all once more. I have a question that makes me feel stupid but i have to get an answer please. I am doing the trading course and i am almost finishing the chapter Building a Strategy. So my problem and my thoughts are this. I have put the strategy on TradingView in the PineEditor and it worked. But after comparing the numbers with @filip i saw differnces and in my surpice i saw that my trading view diagram was set to look the candles in week candles so the crossings were differnd. So i checked the video again and saw that Filip has it to 1h time frame and I put it also in my trading view. My biggest problem now became that when i turn the view in 1h the graph is only until 1 january 2019 and the numbers still differend,because of previous missing data. The data before that period doesn’t saw up and thats why they are not calculated. So if i want to see the diagram for over five years i have to turn it wo weekly view candlstick because if i turn it in quicker candlsticks like 4 hours or 1 hour it is sawing only the chart until january 2019. Any suggestions or am i the only one that happens this?

Hi Filip, Thank you for all the incredible course content you have provided. I have followed your code and been able to add it to the chart with no issues until I changed the date to 2018. I can’t seem to get trading view to allow a date range prior to the start of 2019. Have I not done something right? I am using a free account and am wondering if that is the issue?
Thanks,
Steve

Hello Phillip,

I’m getting some errors in my scrip for Moving Avg Cross for BTC Trading View in Lesson 6. Could you please help and check my code below of why im getting these errors so i can continue the course on trading?

//@version=4
strategy(title=“MovingAvg Cross”, overlay=true)

//Date and Time
fromMonth = input(defval=1, title=“From Month”, minval = 1)
fromDay = input(defval=1, title=“From Day”, minval = 1)
fromYear = input(defval=2019, title=“From Year”, minval =2014)

toMonth = input(defval=1, title=“to Month”, minval =1)
toDay = input(defval=1, title=“to Day”, minval = 1)
toYear = input(defval=2025, title=“to Year”, minval =2014)
//Definitio
ShortMa = sma(close,20)
LongMa = sma(close, 50)
//LOGIC
timeInRange = (time > timestamp (fromYear, fromMonth, fromDay, 00,00)) and (time < timestamp(toYear, toMonth, toDay, 23, 59))
LongSignal = crossover (shortMa, longMa and timeinrange)
ShortSignal = crossover (longMa, shortMa and timeinrange)

//POSITIONS
Strategy.entry (id=“long position”, long=true, when=longSignal)
Strategy.entry (id=“short position”, short=false, when=shortSignal)

Did you change your fromYear and toYear variables in the code to include a different date range? Like this

//DATE AND TIME
fromMonth = input(defval=5, title = "From month", minval=1)
fromDay = input(defval=15, title = "From day", minval=1)
fromYear = input(defval=2018, title = "From year", minval=2014)

toMonth = input(defval=4, title = "To month", minval=1)
toDay = input(defval=15, title = "To day", minval=1)
toYear = input(defval=2020, title = "To year", minval=2014)

Seems to be the same problem that @steve had. Sorry for the very slow response guys, my bad…

2 Likes

Ok, there are a few issues here. Let me address them one and one.

First, you need to remember that variable names are case sensitive. So all name declarations of variables must match the name when you use them. You did this with a few different variables, for example ShortMa.

You declared the variable as ShortMa. Then you used that variable in the crossover function as shortMa. You need to decide to use one of them. Either ShortMa or shortMa. You did this for quite a few variables. Look through your code carefully and you can correct these one by one.

Then you made a mistake when using the crossover function. You included timeinrange in the crossover function, which doesn’t have anything to do with the function call. You want to check for crossover between shortMa and LongMa only. Then, after that, you also want to check so that the crossover happened in the timeframe we picked. So you need to write:

longSignal = crossover (shortMa, longMa) and timeInRange

You see the difference?

Then you also made a small mistake in your short entry call. You wrote short=false as one of the arguments. It should be long=false. Because it’s not a long position, it’s the opposite.

I think that was it. I got it to work. Try if you can fix these issues and get it going. Otherwise let me know and I will help you further :slight_smile:

Hello Phillip,

I made the changes and its better now but still getting some errors. Could you take a look to point me in the right direction?

//@version=4
strategy(title=“MovingAvg Cross”, overlay=true)

//Date and Time
fromMonth = input(defval=1, title=“From Month”, minval = 1)
fromDay = input(defval=1, title=“From Day”, minval = 1)
fromYear = input(defval=2019, title=“From Year”, minval =2014)

toMonth = input(defval=1, title=“to Month”, minval =1)
toDay = input(defval=1, title=“to Day”, minval = 1)
toYear = input(defval=2025, title=“to Year”, minval =2014)
//Definition
ShortMa = sma(close,20)
LongMa = sma(close, 50)
//LOGIC
timeInRange = (time > timestamp(fromYear, fromMonth, fromDay, 00,00)) and (time < timestamp(toYear, toMonth, toDay, 23, 59))
LongSignal = crossover (ShortMa, LongMa) and timeinrange
ShortSignal = crossover (LongMa, ShortMa) and timeinrange

//POSITIONS
Strategy.entry(id=“long position”, Long=true, qty=0.1, when=LongSignal)
Strategy.entry(id=“short position”, Long=false,qty=0.1, when=ShortSignal)

Hi @filip once more. No problem on late answer glad to get one :wink: 
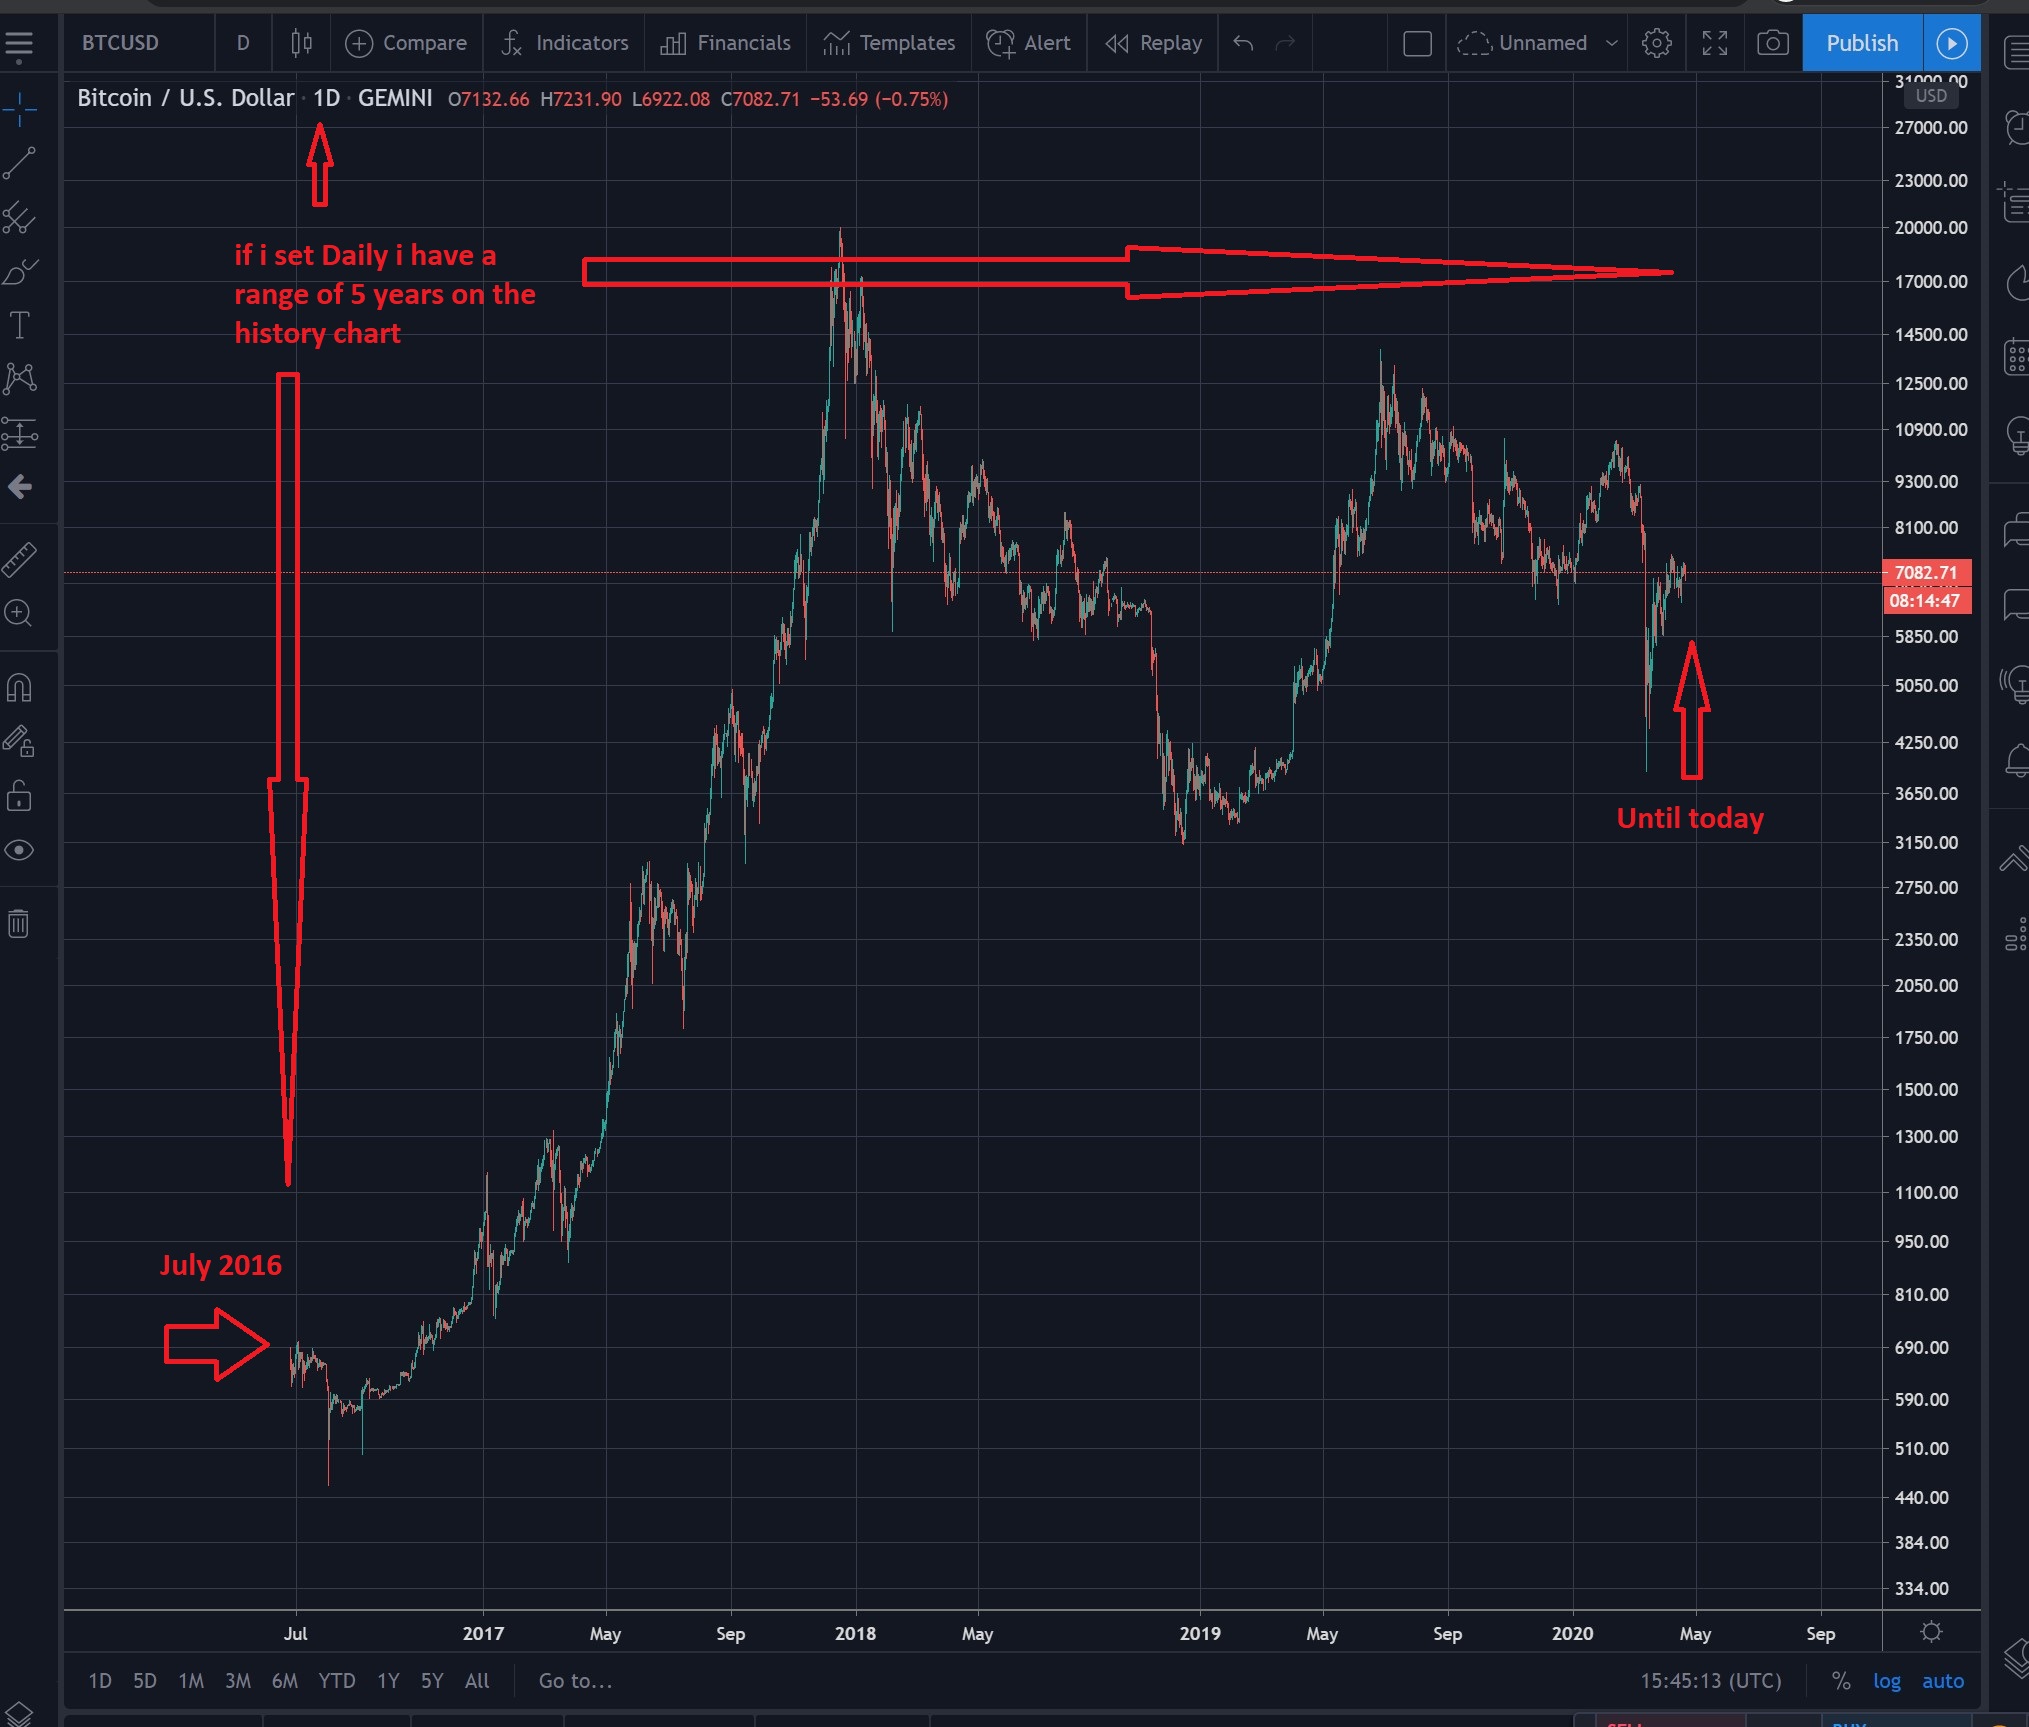
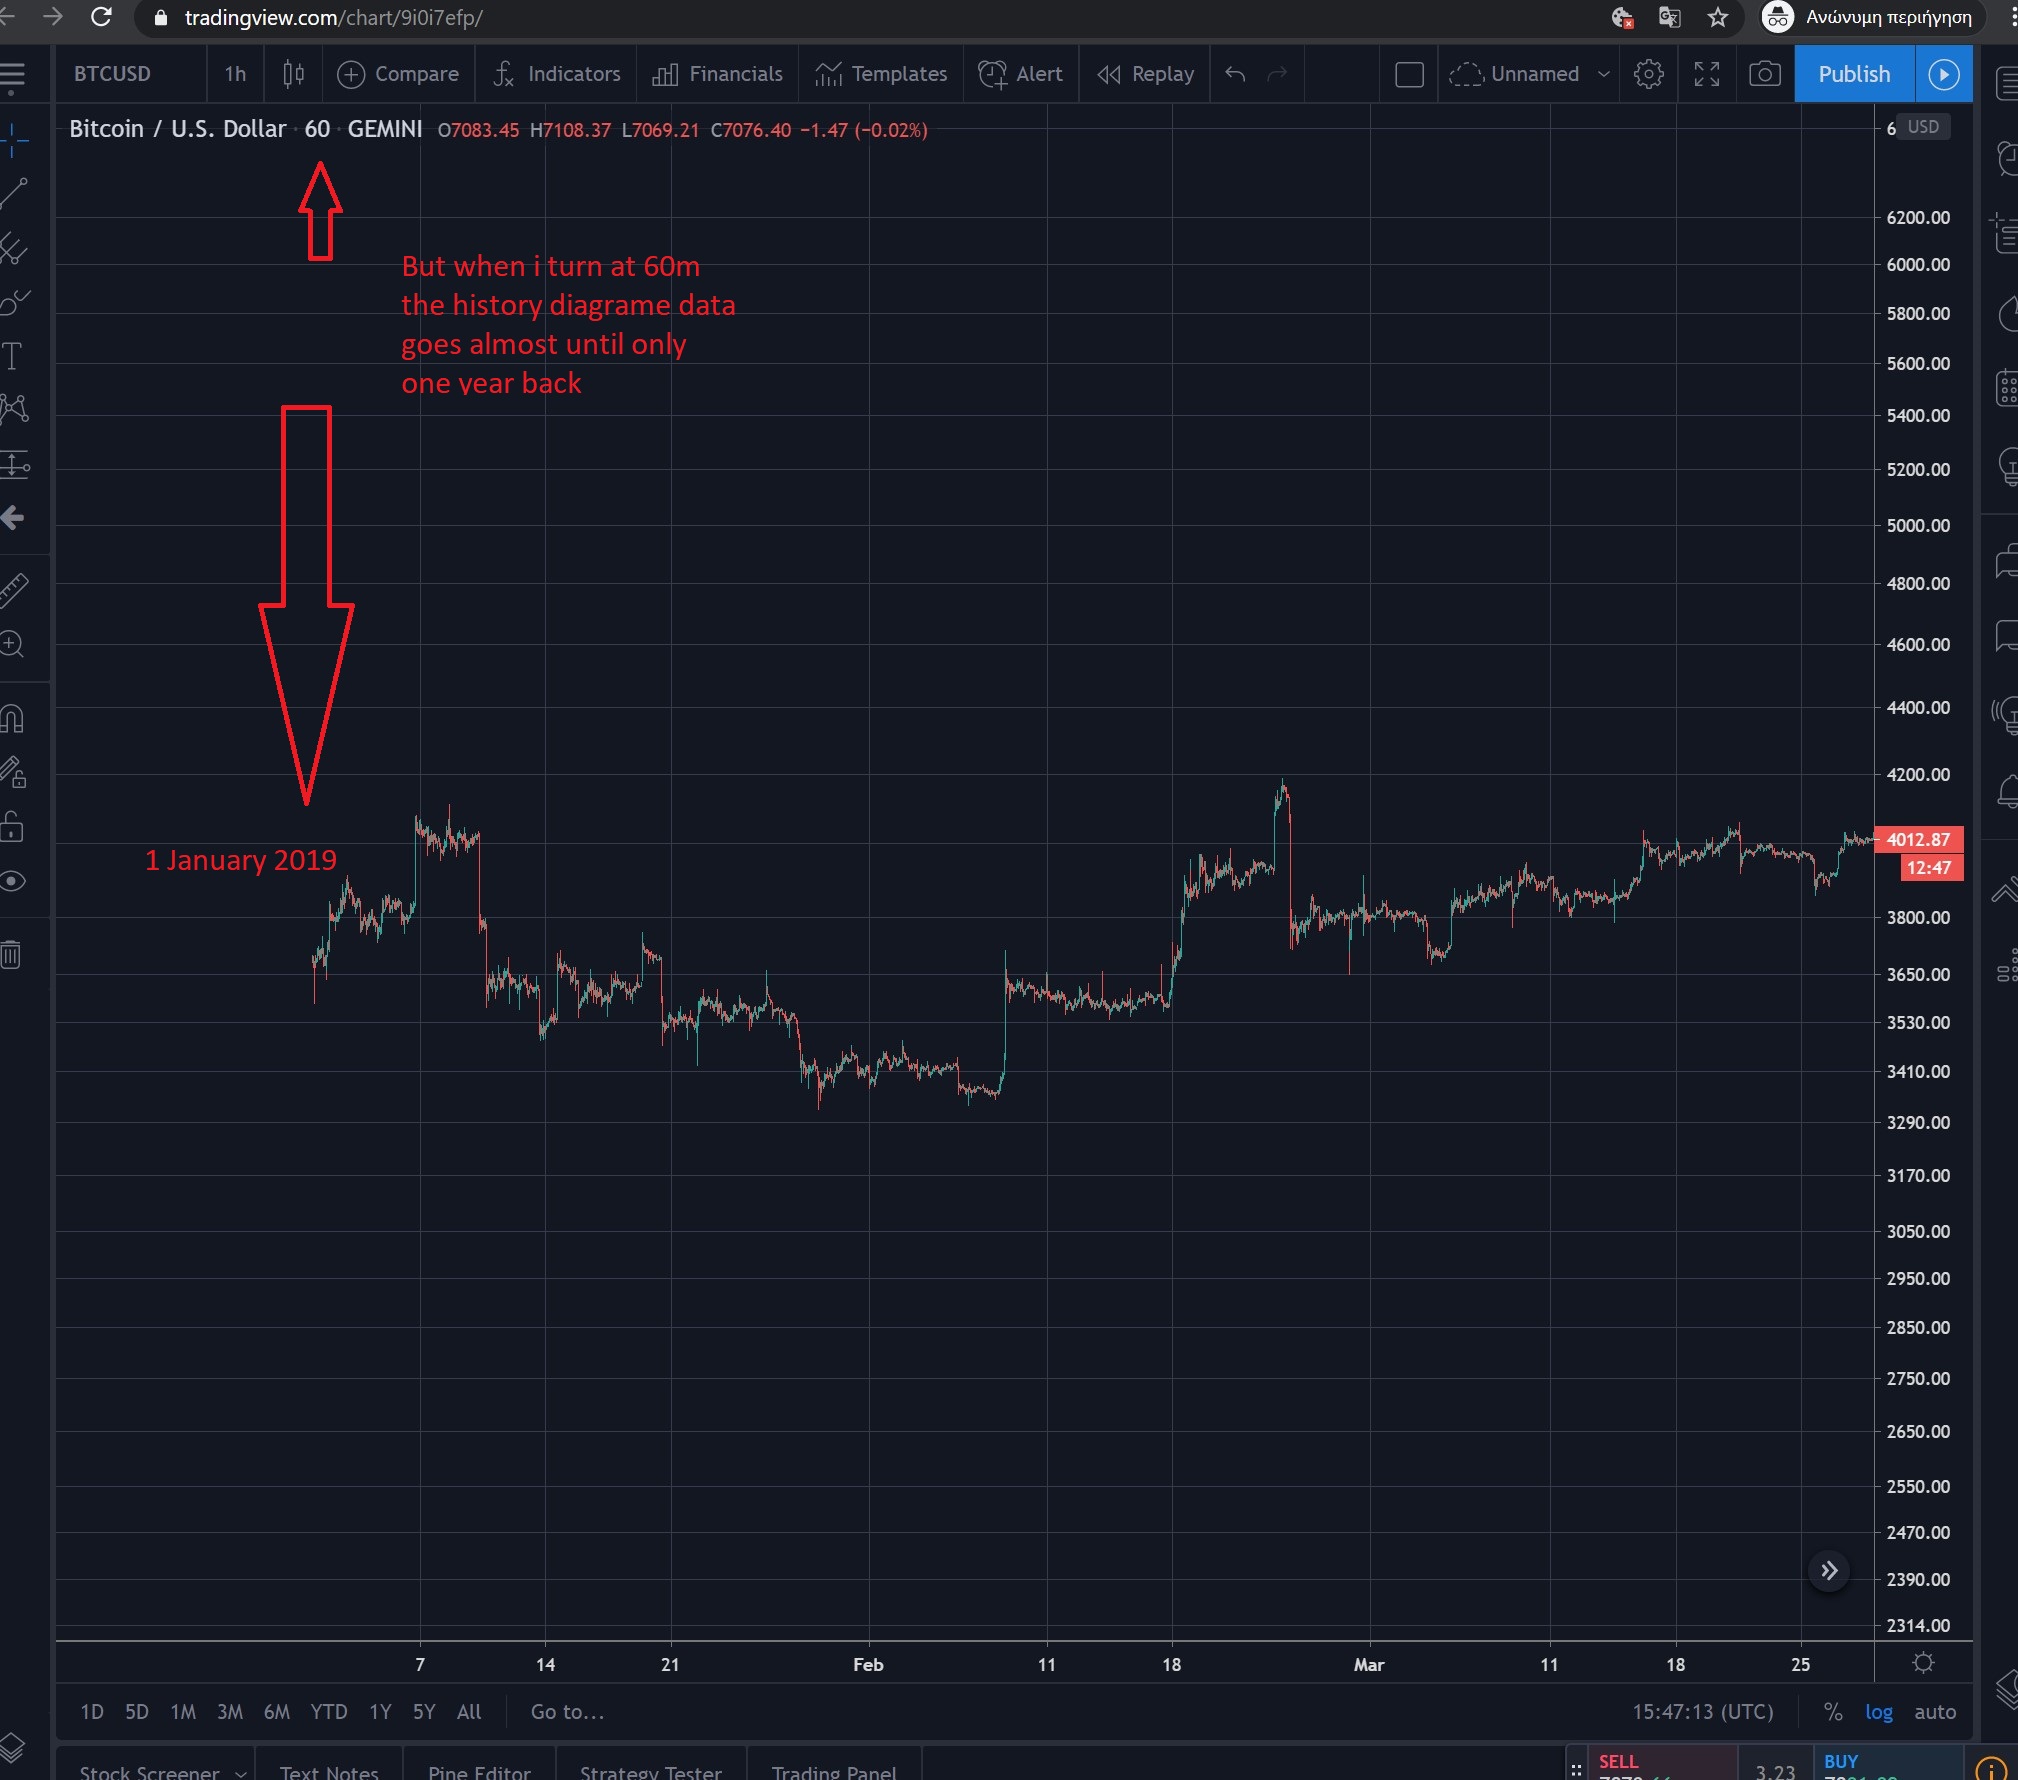
Also found the problem. So my problem was not the code. I had put all the codes like you and later in finishing the lessons on gemini i managed it too. The problem is when you use trading view on free version you are today very restricted in what you can see and how much data you can get. Also the advertisement becomes sometimes a little bit anoying but for the course to understand and do is ok. When you are on free version you can only put max 3 indicators, here is everything i found https://www.tradingview.com/gopro/?source=header_go_pro_button&feature=
In the pictures i have tried to saw you what i mean. It is how @steve says limited for free :upside_down_face:

@filip
I want to implement a basic strategy for entering a buy position when a green 2 closes above a green 1, the color of the number is defined as green if it is higher than the high of 3 candles before it. For it to be a green 1, the prior candle had to be red, meaning it traded lower than the low of 3 candles prior to it. I want to then take profit on the 6th green number, or the open of the candle after the 6.

This strategy does not have any variables and to my understanding the below should be sufficient but it gives me an error " …script cannot be translated from null.

This is what I managed to put together. I a assuming the script needs variables, so I might need some help to see how to reword this into something that pine script can read.

strategy (title = “2 above a 1”, overlay = true)

//Open on green 2 above a green 1
longSignal = close[1]>high[2] and close[2]>high[5] and close[1]>high[4] and close[3]<low[6]

|//TP on green 6
shortSignal = close[6]<low[9] and close[5]>high[8] and close[4]>high[7] and close[3]>high[6] and close[2]>high[5] and close[1]>high[4]

//positions
strategy.entry(id=“longPosition”, long=true, when longSignal)
strategy.entry(id=“shortPosition”, long=false, when shortSignal)

@filip
Or is my fault that my strategy.entry for a short position is actually where my buy position should closes, and I need to write the same for an entry into the short positions, changing the colors (arrows) around?