Building a Strategy Discussion

hi @filip

I have a general question about what we just programmed in pine. When your write stuff like:

shortMa = sma(close,20)

does the 20 ALWAYS refer to DAYS? isnt there a way to define that the moving average is related with hourly candles? or minute candles or 2 hour candles? or whatever time frame that is different to a daily candle?

@filip,

I have another question. Isnt there a way to open leveraged positions?? please respond!!

Candles represent time ranges (5 min, 15 min, 1 hour, 4 hour, 1 day, 15 days
).
The length is set at 20 for example, but it is the number of candles for the time range represented in the chart.

Here you can check it yourself: https://www.tradingview.com/pine-script-reference/#fun_sma

It would be based on a set of strategies that create a algorithm that can be used has leveraged.

Here you can have a better understanding of it:
https://www.tradingview.com/script/vOaKc2FV-Leverage-Strategy-and-a-few-words-on-risk-opportunity/

If you have any more questions, please let us know so we can help you! :slight_smile:

Carlos Z.

1 Like

thanks a lot @thecil !!! 
 I think i will defintely check out how to work with different time ranges.

I have another question tough: I it possible to simulate a strategy using various different time ranges for back testing? For example: Filip just compared 2 different time frames to check that he is not curve-fitting, right? But I think it would be much better to test for, say, a 100 or 200 time frames at the same time. Is that possible? for example, if I have a 5 year period, I could take 1 year period for back testing, but move the time period 10 days at a time for example and backtest it like that. Is there a way to simulate that kind of think using trading view, or would I have to program that simulation using something that interacts with trading view?

1 Like

Yes it is possible by programming multiple strategies for different time ranges or optimizing an strategy to work in different time ranges, back testing over time ranges is probably the best way to test your strategy to work over different market conditions and get a result of it to later optimize it.

With trading view you can use their pine script language to design and simulate different strategies.

What you would need is to set some variables that limit time ranges (you should get them further from filip in the course, at least the basic idea on how to limit time ranges for different purposes).

If you have any more questions, please let us know so we can help you! :slight_smile:

Carlos Z.

1 Like

Hello I cant seem to get tradingview to show me candles in 2018 when I set it to hourly. I have to set it to daily and when its like that it doesn’t even execute any trades when i add the Moving Average Crossing strategy.

1 Like

Hi @RCV, hope you are ok.

Would you please share your trading script so we can help you solve the issue? :nerd_face:

You can use the “Preformatted Text” Button to encapsulate any kind of code you want to show.


function formatText(){

let words = “I’m a preformatted Text box, Please use me wisely!”

}

prefromatted_text-animated

If you have any more questions, please let us know so we can help you! :slight_smile:

Carlos Z.

//@version=3

strategy(title="Moving Average Crossing", overlay=true)

//Date And Time
fromMonth = input(defval=1, title = "From month", minval=1)
fromDay = input(defval=1, title = "From day", minval=1)
fromYear = input(defval=2019, title = "From year", minval=2014)

toMonth = input(defval=1, title = "To month", minval=1)
toDay = input(defval=1, title = "To day", minval=1)
toYear = input(defval=2025, title = "To year", minval=2014)


//Definitions
shortMa = sma(close, 20)
longMa = sma(close, 50)

//Logic
timeInRange = (time > timestamp(fromYear, fromMonth, fromDay, 00, 00)) and (time < timestamp(toYear, toMonth, toDay, 23, 59))
longSignal = crossover(shortMa, longMa) and timeInRange
shortSignal = crossover(longMa, shortMa) and timeInRange

//Position
strategy.entry(id="longPosition", long=true, when=longSignal)
strategy.entry(id="shortPosition", long=false, when=shortSignal)

heres my screen if that helps. I dont think its the code but iam uncertain.

1 Like

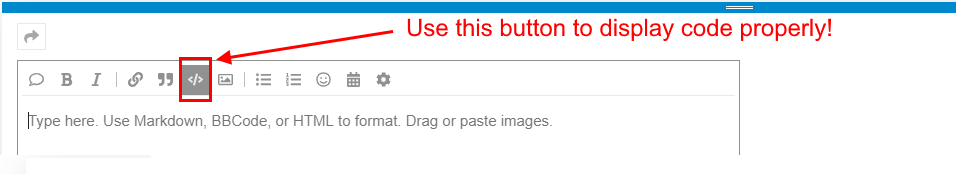
Alright so I am creating a trading system on pinescript and I keep running into a undeclared identifier error and I also get an error that says that I need an output function for the strategy show on the graph, here is my code:

strategy(title ="My Long term strategy", overlay=true)

//DEFINITIONS
shortMa = ema(close,8)
longMa = ema(close, 14)
//MACD indicator
macdShort = input(12, minval=1, title ="MACD Fast length")
macdLong = input(26, minval=1, title = "MACD Slow Length")
macdSignal = input(9, minval=1, title = "MACD Signal Length")
mac= macd(close,macdShort, macdLong, macdSignal)
MACDLine= (macdShort - macdLong) 
//SignalLine= 9
//MACDHistogram: MACDLine - SignalLine

//Stochastic indicator
Length = input(14, minval = 1, title = "stochastic Length")
k= input(3,minval = 1, title= "stochastic%k")
d= input(3,minval = 1, title= "stochastic%d")
sto = stoch(close,highest(Length),lowest(Length), Length)
stoUppper = hline(80, title="Upper Limit",color=color.red, linestyle=hline.style_dotted)
stoLower = hline(20, title="Lower Limit", color=color.lime, linestyle=hline.style_dotted)

//VWAP indicator
v = vwap(hlc3)

// RSI indicator
src = close 
RSIlen = input(14, minval=1,title="RSI length")
EMAlen =input(10, minval=1 , title = "RSI EMA Length")
Up = rma(max(change(src),0), RSIlen)
Down = rma(-min(change(src), 0), RSIlen)
rsi= Down == 0 ? 100: Up == 0 ? 0:100 -(100/(1+Up/Down))
RSIEMA = ema(rsi,EMAlen)
band1 = hline(70, color=color.red, title = "Upper Line", linestyle=hline.style_solid)
band0 = hline(30, color=color.lime, title = "Lower Line", linestyle=hline.style_solid)
 
 //LOGIC
 longsignal = crossover(shortMa, longMa)
 macdlong = crossover(macdline, macdSignal)
 stolong = crossover(k and d, lowerlimit)
 vlong = crossover(close,v)
 RSIlong = crossover(rsi and RSIEMA, band0)
 
 //POSITIONS
strategy.entry(id = "longPosition", long=true, when=longsignal and macdlong and stolong and vlong and RSIlong)

Can someone plz take a look at the code above and tell me how to fix the errors?

1 Like

Suggestions sent via Private Message :nerd_face:

Carlos Z

Hi there. I’m busy with tweaking the moving average strategy in Pine Editor.
but, I want the short to happen just before the crossover. for example if the 20MA becomes level or just make a curve downward. would this be possible to make?

1 Like

Hi Team,

This script seems to work well with eth/usd and I want to try it with stop and loss. Can you take a look and let me know any thoughts. I mainly concerned about my stop loss’s in place to protect my downside.

Also, in strategy entry, what does the 100 represent, as i set my initial investment at 1000, so does that mean its 100 dollar bets?

The numbers also don’t quite seem right for 1000 dollar investment. Ive attached a picture based on 5 day.

Thanks in advance, much appreciated.

Kofi

// This source code is subject to the terms of the Mozilla Public License 2.0 at https://mozilla.org/MPL/2.0/
// © Kingkofi87

//@version=4
strategy(“Take profits & stop losses”, overlay=true)

// Create Indicator’s
shortSMA = sma(close, 10)
longSMA = sma(close, 30)
rsi = rsi(close, 14)
atr = atr(14)

// Specify crossover conditions
longCondition = crossover(shortSMA, longSMA)
shortCondition = crossunder(shortSMA, longSMA)

// Execute trade if condition is True
if (longCondition)
stopLoss = low - atr * 2
takeProfit = high + atr * 2
strategy.entry(“long”, strategy.long, 100, when = rsi > 50)
strategy.exit(“exit”, “long”, stop=stopLoss, limit=takeProfit)

if (shortCondition)
stopLoss = high + atr * 2
takeProfit = low - atr * 2
strategy.entry(“short”, strategy.short, 100, when = rsi < 50)
strategy.exit(“exit”, “short”, stop=stopLoss, limit=takeProfit)

// Plot Moving Average’s to chart
plot(shortSMA)
plot(longSMA, color=color.black)

Thanks

2 Likes

Hi there guys


With regards to adding my Moving Average Crossing strategy to my chart "Add to Chart ".

Do I have to upgrade my Tradingview to be able to go forward? I get a pop up " 30 Day Free Trial" message from Tradingview that keeps coming up to say I can upgrade.

It saves it but doesn’t upgrade the chart, any advice


1 Like

// This source code is subject to the terms of the Mozilla Public License 2.0 at https://mozilla.org/MPL/2.0/
// © Bluebits

//@version=3

strategy(title=“Moving Averages Crossing”, overlay=true)

//DEFINITIONS
shortMa = sma(close, 20)
longMa = sma(close, 50)

//LOGIC
longSignal = crossover(shortMa, longMa)
shortSignal = crossover(longMa, shortMa)

//POSITIONS
strategy.entry(id=“longPosition”, long=true, when=longSignal)
strategy.entry(id=“shortPositon”, long=false, when=shortSignal)

Hey @Heyde, hope you are great.

About the message of trading view, with the free account you can only use 1 chart indicator, but you can remove it to place another one, just by clicking on the remove button which is the X.

image

If you have any more questions, please let us know so we can help you! :slight_smile:

Carlos Z.

Hello, I think I copied the code exactly, but I got an error that I have 4 unidentified indicators, what did I do wrong?

strategy(title=“Moving Average Crossing”, overlay = true)

//DEFINITIONS
shortMa = sma(close, 20)
longtMa = sma(close, 250)

//LOGIC
longSignal = crossover(shortMa, longMa)
shortSignal = crossover(longMa, shortMa)

Thanks!

1 Like

Hi @SabineB, hope you are well.

You have a mistype error in one of your definitions:
longtMa = sma(close, 250)

While in the Logic signals, you have longMa.

Also you might need to use plot to have at least one output function.

Here you can read more about that one and others: https://www.tradingview.com/pine-script-reference/#fun_plot

If you have any more questions, please let us know so we can help you! :slight_smile:

Carlos Z.

Its amazing. Have u managed to use it in real life?

@filip Hi, for some reason trading view show some error on the code when I am trying to put it “Add to Chart”
In the code, Bolded lines are the error lines based on Trading View


please, could someone check?

strategy(title=“Moving Averages”, overlay=true)

//DATE AND TIME
fromMonth = input(defval=1, title = “From month”, minval=1)
fromDay = input(defval=1, title = “From day”, minval=1)
fromYear = input(defval=2019, title = “From month”, minval=2014)

toMonth = input(defval=1, title = “To month”, minval=1)
toDay = input(defval=1, title = “To day”, minval=1)
toYear = input(defval=2022, title = “To month”, minval=2014)

//DEFINITIONS
shortMa = sma(close, 20)
longMa = sma(close, 50)

//LOGIC
timeInRange = (time > timestamp(fromYear, fromMonth, fromDay, 00, 00)) and (time < timestamp(toYear, toMonth, toDay, 23,59))
longSignal = crossover(shortMa, longMa) and timeInrange
shortSignal = crossover(longMa, shortMa) and timeInRange

//POSITIONS
strategy.entry(id=“longPosition”, long=true, when=longSignal)
strategy.entry(id=“shortPosition”, long=false, when=shortSignal)

you have misspell timeInRange for the longSignal variable, (capital R).

Carlos Z