
Welcome to this discussion thread. Feel free to ask questions or discuss things related to this section.
1 Like
Does anybody have an idea on how to use an external database? For example using the number of google-searches per day. I know…not a great idea, but just to learn more how to use Pine Editor
The last I checked it was not possible with external api calls. You would have to work with your own script like Ivan is showing you at the end of the course.
1 Like
Hi filip,
Really enjoying the course so far! I have a question though forgive me if I missed this in the course. When I change time frames I get radically different results in terms of profits and losses for the same strategy I have added to the chart. Is there a way to set your strategy to a 1 hour ,4 hour or daily candles through pinescript?
thanks again for the knowledge
FJ
Yes, but that’s completely normal. If you switch timeframe, then all values will be different. Prices will be different, moving averages different, everything will be different since the candles are different.
You can use the security function to create a variable that holds data for a specific security with a specific timeframe. But this is usually only necessary if you want to work with multiple timeframes at once. Otherwise you should simply choose the timeframe in the chart.
Here is info about the function I’m talking about. https://www.tradingview.com/study-script-reference/#fun_security. And a video if that helps: https://www.youtube.com/watch?v=K60Jc5WXsH4
Thank you for replying to me Filip!
1 Like

Hey,
Have you tried this with real money?
I was wondering how accurate this is compared to real life trading. Do you have any servers or services you recommend for going live?
It would be nice to have a setup so that everything does not shut down if my computer crashes, goes to sleep, shuts down etc.
My results are based on daily chart, would you do a strategy that performs well on higher time frames and not good on lower time frames, or find a strategy that works well on all time frames?
Thanks!
1 Like
It’s always very hard to know. Usually you need to test the algo in real life as well. That’s for multiple reasons. When you simulate your trades, tradingview will interpret the history of the chart in the most favorable way possible when executing your trades. In reality, it might differ.
Also, you don’t really know if you have over-fitted your algo until you try it in real life.
Tradingview has a few brokers that they support, for example poloniex. If you are able to, I would suggest you try one of them.
Allright, thanks man!
1 Like
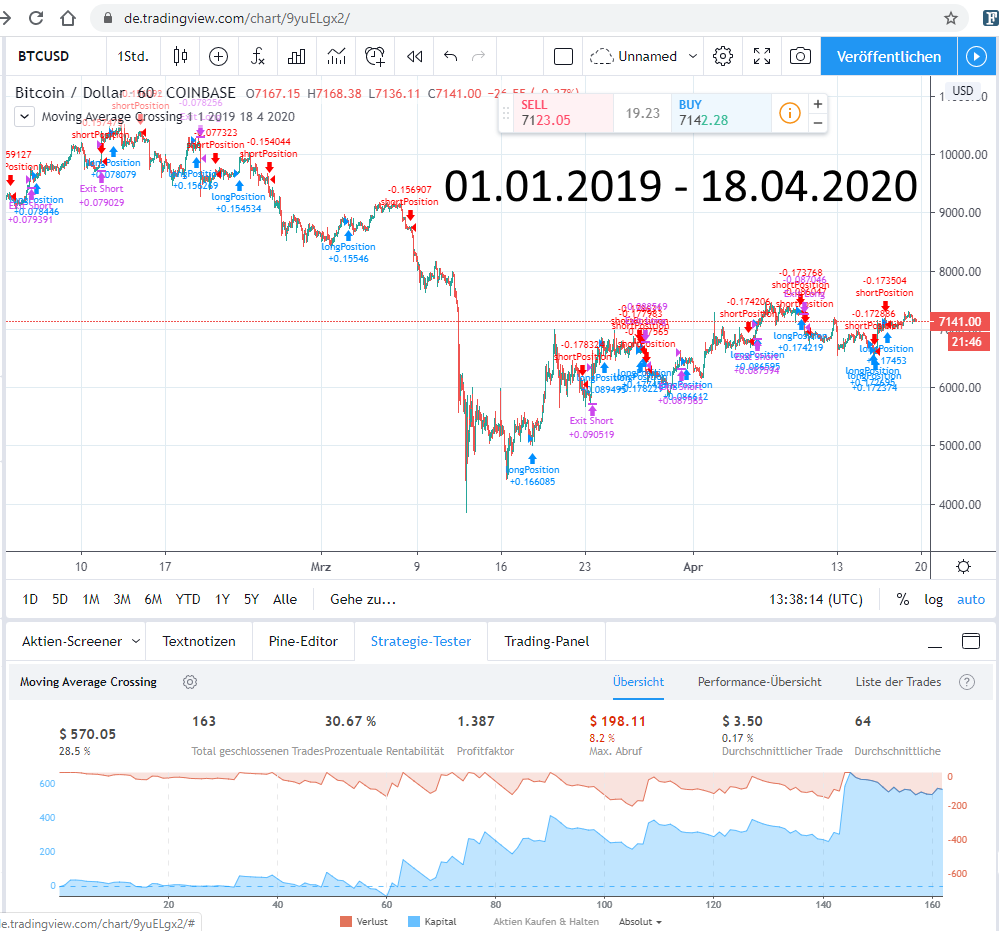
30 profit factor? The most I’ve done with tweaking this algo. is 6. Did you make any other major changes? I’m not sure if I’m doing something wrong.
Trading Algorithm Version 2.0
I just wanted to post my version of our test trading algorithm with the latest changes:
- Adding max_risk parameter for risk management
- Adding and tweaking a stoploss parameter for exiting the strategy
- Adapting the size of the orders to
size = max_risk / stoploss
// This source code is subject to the terms of the Mozilla Public License 2.0 at https://mozilla.org/MPL/2.0/
// © andreashansch

//@version=3
strategy(title="Moving Average Crossing", overlay=true, initial_capital=2000, commission_type=strategy.commission.percent, commission_value=0.2)

//DATE AND TIME
fromDay   = input(defval=1, title = "From day", minval=1)
fromMonth = input(defval=1, title = "From month", minval=1)
fromYear  = input(defval=2019, title = "From year", minval=2019)

toDay   = input(defval=18, title = "To day", minval=1)
toMonth = input(defval=4, title = "To month", minval=1)
toYear  = input(defval=2020, title = "To year", minval=2019)

//DEFINITIONS
shortMa  = sma(close, 49)
longMa   = sma(close, 81)
max_risk = strategy.equity * 0.01
stoploss = 295
size     = max_risk / stoploss

//LOGIC
timeInRange = (time > timestamp(fromYear, fromMonth, fromDay, 00, 00)) and (time < timestamp(toYear, toMonth, toDay, 23, 59))
longSignal  = crossover(shortMa, longMa)
shortSignal = crossover(longMa, shortMa)

//POSITIONS
strategy.entry(id="longPosition", long=true, qty=size, when=longSignal and timeInRange)
strategy.entry(id="shortPosition", long=false, qty=size, when=shortSignal and timeInRange)

strategy.exit("Exit Long", from_entry = "longPosition", loss = stoploss * 100)
strategy.exit("Exit Short", from_entry = "shortPosition", loss = stoploss * 100)
1 Like
Hi, I took ideas from other strategies published in TradingView. It was interesting to set inputs in box dialog. My code for StopLoss and Size calculation is as follows
// ======== Risk Management ===========
risk = input(0.01, title="% Portfolio Value at Risk")
stop_loss = input(0.15, title="% Stop Loss")
profit = input(1, title="% Profit")

max_risk = strategy.equity * risk
loss = stop_loss * close
size = max_risk / loss
In that way you can set as percentages the risk and stop-loss for each trade over the equity.
Thank you for your great content! It’s helping me a lot!
Hi, does anybody have a base script for a Long strategy using Stochastic RSI? thank you
Hi ! I did a bid of testing with the StopLoss Orders. But anyway i am doing not really good at the moment. I am wondering if it is me or if it is that i am using different datasets. The samples (timedates) shown in the lecture are not accessible for me. ( I only have a free account from TV and as far as i can see they only have data from 2020) .
I also copied some other scripts in this forum and tried to get the same results. But unfortunately i am failing all the times.
I am using this script
//@version=4
// use the right commission type
strategy(title="Moving Average Crossing Adapted 2021", overlay=true, initial_capital=2000, commission_type=strategy.commission.percent, commission_value=0.2)

// Date and Time for Backtesting
fromYear = input(defval=2021, title="From year" , minval=2014)
fromMonth = input(defval=1, title="From month" , minval=1)
fromDay = input(defval=1, title="From day" , minval=1)

toYear = input(defval=2021, title="To year" , minval=2014)
toMonth = input(defval=5, title="To month" , minval=1)
toDay = input(defval=28, title="To day" , minval=1)

//Coding
shortMa = sma(close, 20)
longMa =  sma(close, 50)
// Max 1% per trade
max_risk = strategy.equity * 0.01
stopLoss = 100
size = max_risk/stopLoss

// Logic
timeInRange = (time > timestamp(fromYear, fromMonth, fromDay, 00,00)) and (time < timestamp ( toYear, toMonth, toDay, 23, 59))
longSignal = crossover(shortMa, longMa) and timeInRange
shortSignal = crossover(longMa, shortMa) and timeInRange

// Positions
strategy.entry(id="longPosition", long=true , qty=size , when=longSignal==true)
strategy.entry(id="shortPosition", long=false , qty=size,  when=shortSignal==true)

// Exit with stopLoss
strategy.exit("Exit Long" , from_entry = "longPosition", loss = stopLoss*100)
strategy.exit("Exit Short" , from_entry = "shortPosition", loss = stopLoss *100)
My question:
Does anybody has a script with valid data which makes profit ? What Pairs and CandleSticks indicators ( 1hour , 1day etc) do you use?
1 Like
Hi Filip, I hope your are well. Thank you for the great content.
I need your help on my strategy which is based on stoch rsi.
For some reason my exit doesn’t work like i want to. I’ve tried to figure it out but with no luck so far. Please see below:
//@version=4
//STRATEGY SECTION
strategy(title=“Stoch RSI Crossing”, overlay=true,pyramiding=1, initial_capital=1000, commission_type=“strategy.commission.percent”, commission_value=0.2)
//DATE AND TIME
fromMonth = input(defval=5, title = “From Month”, minval=1)
fromDay = input(defval=15, title = “From Day”, minval=1)
fromYear = input(defval=2018, title = “From Year”, minval=2014)
toMonth = input(defval=8, title = “To Month”, minval=1)
toDay = input(defval=15, title = “To Day”, minval=1)
toYear = input(defval=2018, title = “To Year”, minval=2014)
//DEFINITION
Lenght = input(14, minval=1, title=“Stochastic Lenght”)
RSILenght = input(14, minval=1, title=“RSI Lenght”)
smoothk = input(3, minval=1, title=“Stochastic %k”)
smoothd = input(3, minval=1, title=“Stochastic %D”)
UpperLimit = input(80, title=“Upper Limit”)
LowerLimit = input(20, title=“Upper Limit”)
RSI = rsi(close, RSILenght)
Sto = stoch(RSI, RSI, RSI, Lenght)
K = sma(Sto, smoothk)
D = sma(K, smoothd)
plot(K, title="%K", color=color.new(color.yellow, 0), linewidth=2)
plot(D, title="%D", color=color.new(color.red, 0), linewidth=2)
hline(UpperLimit, title=“Upper Limit”, color=color.new(color.red, 0), linestyle=hline.style_dashed)
hline(LowerLimit, title=“Lower Limit”, color=color.new(color.lime, 0), linestyle=hline.style_solid)
CrossedUp = crossover(K, D) and D <= LowerLimit
CrossedDown = crossunder(K, D) and D >= UpperLimit
bgcolor(CrossedUp ? color.green : na, transp=50)
bgcolor(CrossedDown ? color.red : na, transp=50)
max_risk = strategy.equity * 0.01
stoploss = 100
size = max_risk/stoploss
//LOGIC
timeInRange =(time > timestamp(fromYear, fromMonth, fromDay, 00,00)) and (time < timestamp(toYear, toMonth, toDay, 23,59))
longSignal = CrossedUp and timeInRange
shortSignal = CrossedDown and timeInRange
//POSITIONS
if strategy.position_size == 0
strategy.entry(id=“longPosition”, long=true, qty=size, when=longSignal)
//strategy.entry(id=“shortPosition”,long=false,qty=size,when=shortSignal)
if strategy.position_size > 0
strategy.exit(id=“Exit Long”,from_entry = “longPosition”, loss = stoploss *100, when=shortSignal)
//strategy.exit(id=“Exit Short”,from_entry = “shortPostion”,loss = stoploss *100)
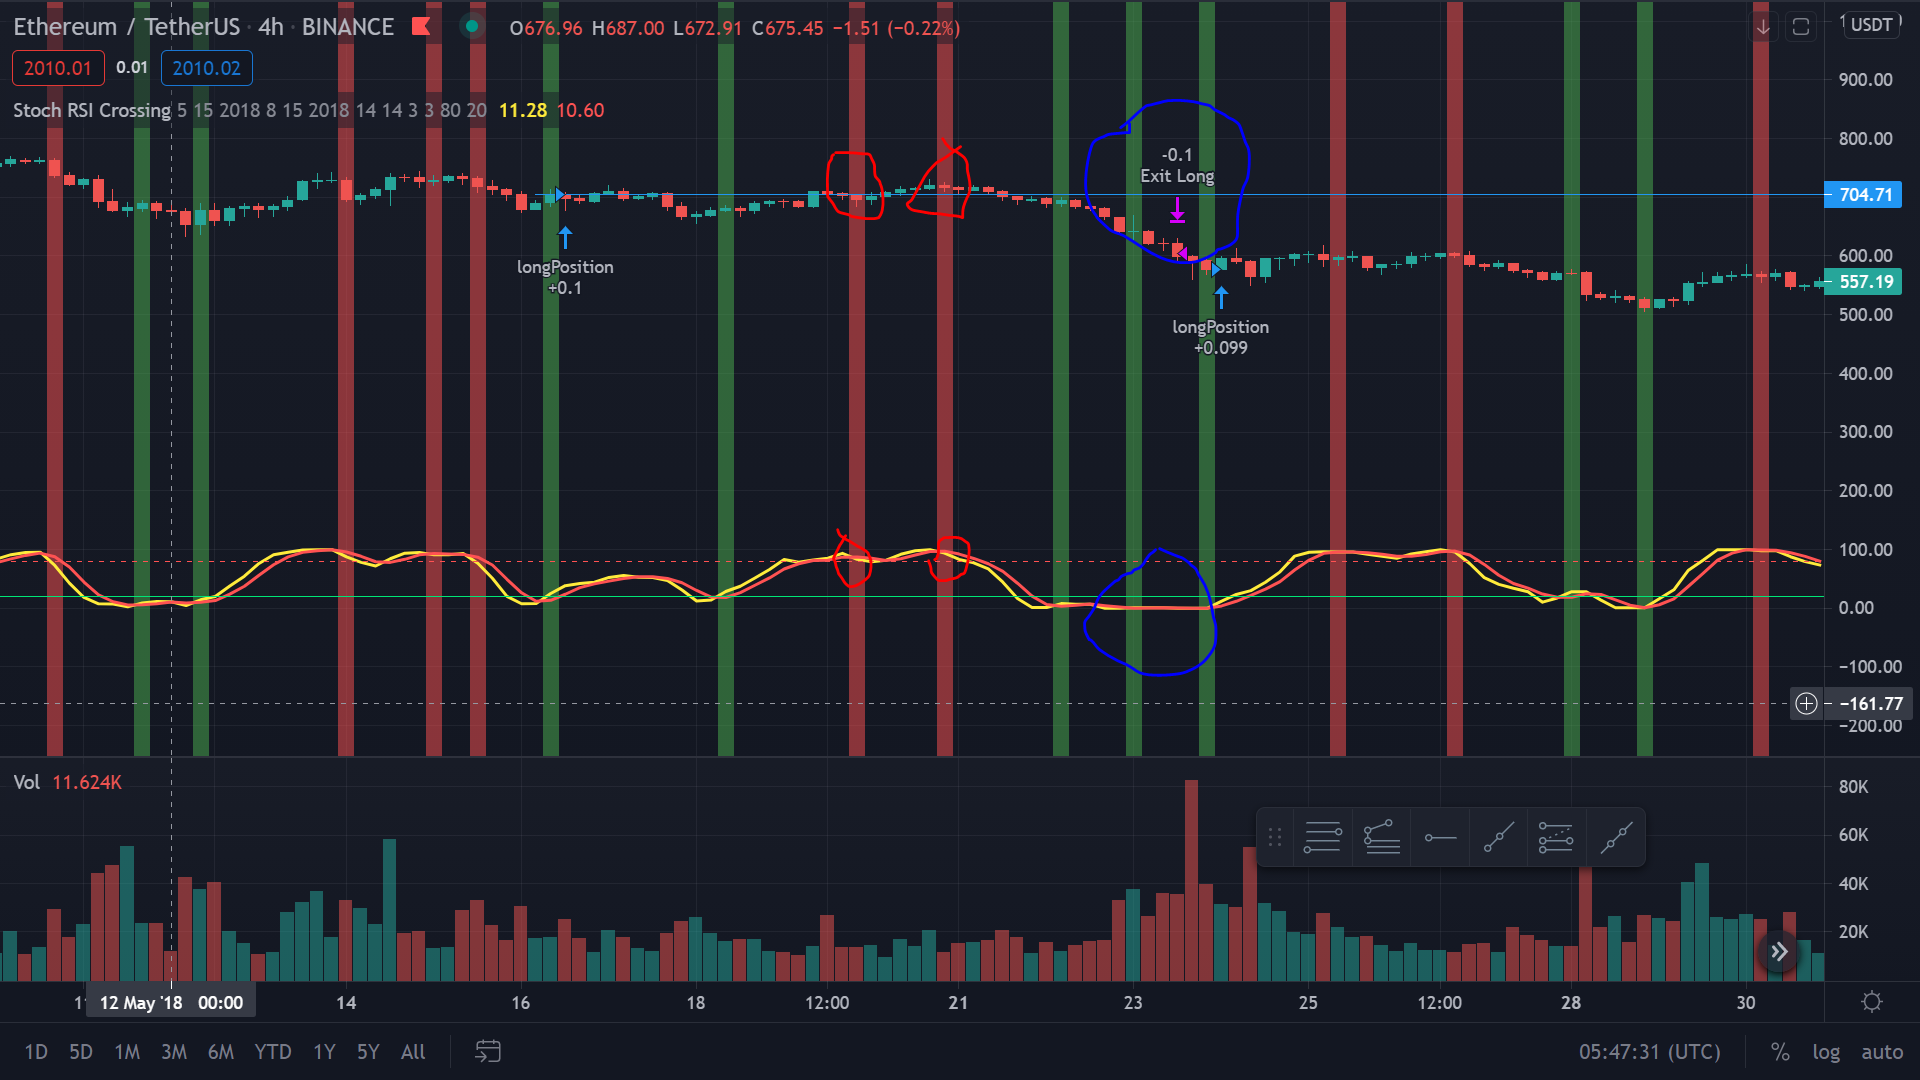
The above is supposed to exit the position when K line cross under D when D > upper line. It doesn’t do it.
Can you please tell me what i have done wrong?
Many thanks,
Leo
1 Like
Hey Guys, Can somebody help, please? I am still stuck 
1 Like
Please provide the entire code so i can tested it properly.
Here you can check how to post code properly in the forum:
https://forum.ivanontech.com/t/faq-how-to-post-code-in-the-forum/35357/2
Carlos Z
1 Like
Hi Thecil, thank for trying to help. I ended up restarting from scratch
1 Like
I’m getting caught up on the risk management formula. Are you saying the Position size would only be $0.20 worth of BTC? I can’t understand how that would work and how you could lose $100 with that trade. Can somebody explain this?
Porfolio Size: $2000
1% Portfolio Size: $20
Position Size: .2
Stoploss: $100
Hello, anyone can help me? I keep having this error
Error [ERR_REQUIRE_ESM]: Must use import to load ES Module: C:\Users\User\Desktop\programming course\bot\node_modules\node-fetch\src\index.js
require() of ES modules is not supported.
require() of C:\Users\User\Desktop\programming course\bot\node_modules\node-fetch\src\index.js from C:\Users\User\Desktop\programming course\bot\index.js is an ES module file as it is a .js file whose nearest parent package.json contains “type”: “module” which defines all .js files in that package scope as ES modules.
Instead rename C:\Users\User\Desktop\programming course\bot\node_modules\node-fetch\src\index.js to end in .cjs, change the requiring code to use import(), or remove “type”: “module” from C:\Users\User\Desktop\programming course\bot\node_modules\node-fetch\package.json.
I tried removing the type module but another error pops up after…
How can I fix this?
Here is my code btw…
global.fetch = require(“node-fetch”);
const GeminiAPI = require(“gemini-api”).default;
const secret = “feiqWwLPvfWwJYwgDHpaiz4Mhuh”;
const key = “account-sPf4oFiwF3fd1X3RPawZ”;
const CCAPIKey = “xxxx”
const restClient = new GeminiAPI({key, secret, sandbox:true});
const CryptoCompareAPI = require(“cryptocompare”);
CryptoCompareAPI.setApiKey(CCAPIKey);
//restClient.newOrder({amount:1.5,price:44000,side:“buy”,symbol:“btcusd”})
//restClient.newOrder({amount:2,price:100,side:“buy”,symbol:“btcusd”})
//restClient.newOrder({amount:3,price:100,side:“buy”,symbol:“btcusd”})
//restClient.getAllSymbols()
//restClient.getOrderBook(“btcusd”)
//restClient.getMyAvailableBalances()
//.then(response => console.log(response.order_id))
//.then(response => restClient.cancelOrder({order_id:response.order_id}))
//restClient.cancelAllActiveOrders()
.then(response => console.log(response))
.catch(error => console.log(error));
CryptoCompareAPI.histoHour(‘BTC’, ‘USD’)
.then(data => {
console.log(data)
})
.catch(console.error)