
This question is not trading related  Sorry for asking, but in the Trends & Channels video there is a very intersting image in the background (1:31 minute). What type of allien is that?
Yes I agree that’s a good use for MA.
Haha I’ll leave the alien a mystery…
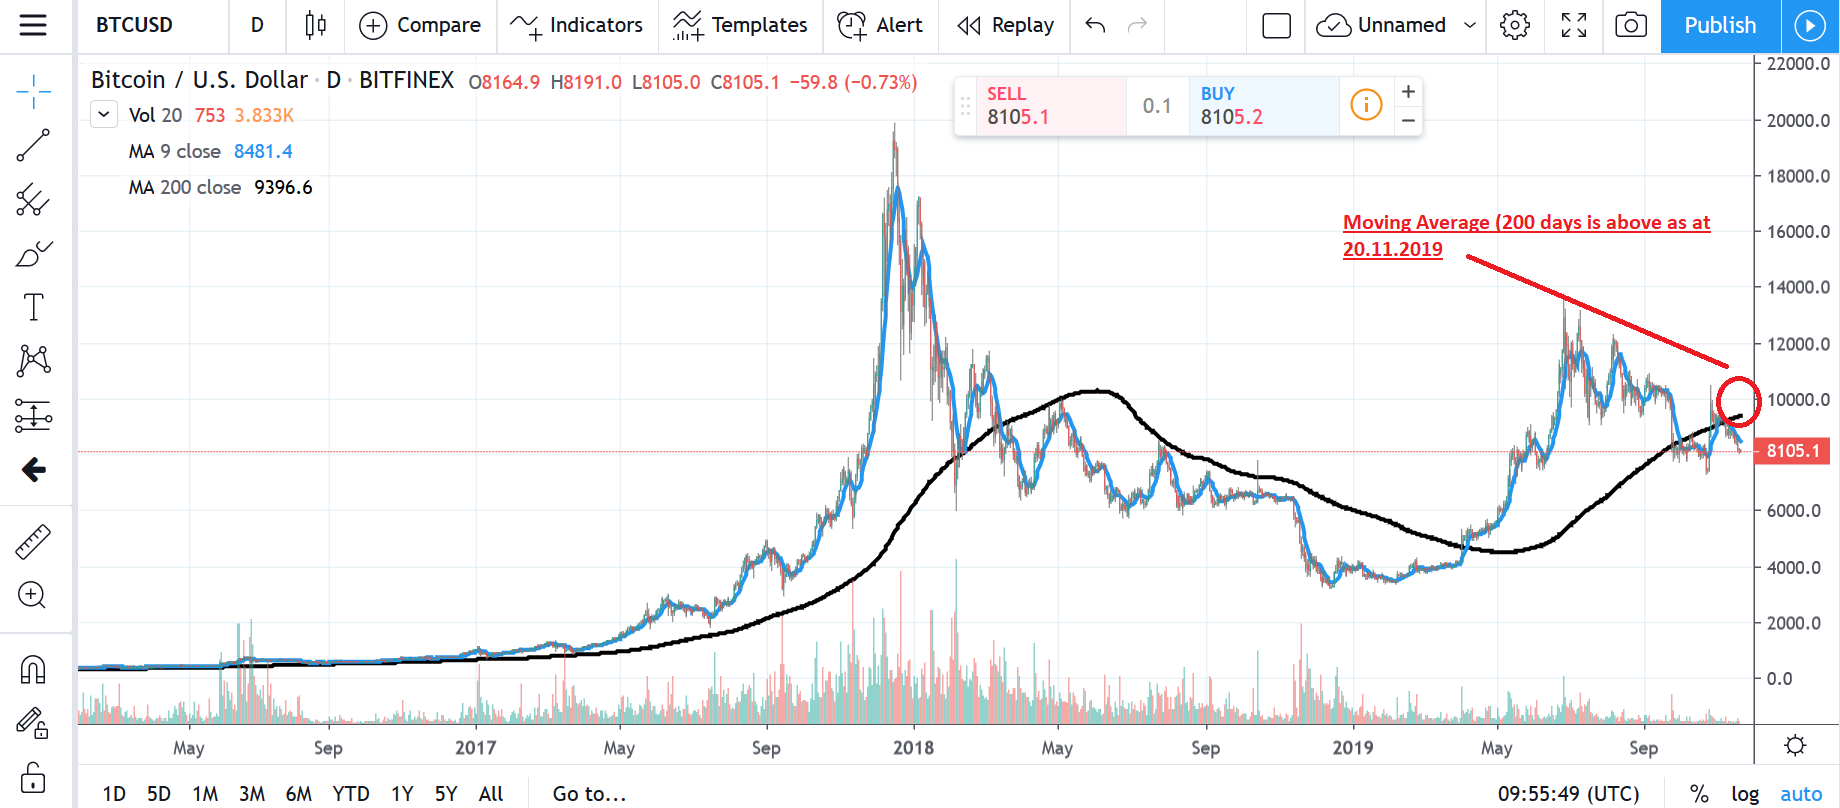
Long term trend - Moving average (200 days) is above the daily/9 days moving average. It seems like an indicator of bearish
Am I right?
1 Like
Love your presentation so far. Just want to find out what charting software were you using.in the trendline presentation.
1 Like

Video was terrible only caught a few words. What was your high lite point?
1 Like
When you see a trend going up or down how long can these trends last and should you look to see if news has anything to do with the trend?
1 Like
Thanks for the great trading videos.
I have a question regarding candles, you always use the whole candle meaning also its wick to draw a channel, support, etc. but I have seen many other traders disregard the candle’s wick. Can you elaborate on that please.
Where can we leave a review about course instructors?
What are some of the predictive methods that people use in this context? Does anyone ever use a predictive estimator with a model to get a better estimate of market signals? The only part that is not clear to me is that input quantities would such a model have? I mean in theory we could predict hidden state as well and get some cool insights from the data, but we would need to have a clear idea of what that hidden state would be.
Isn’t it a bit such that these trends work mainly because all substantial traders follow them? Ie if everyone suddenly sees support and makes their buying decisions based on that then that level automatically becomes the sustained support level.
I’m not getting points when I complete lessons. I’m at zero on the “leaderboard.”
Are trend lines useful/valid because “everyone” trades based on the trend lines? In other words, if the crowd is buying and selling using the same technical analysis, then everything becomes more predictable?
Hi Martin,
I should have read your question before I asked mine. You seem more informed than I. I always wondered why these guys in these videos are always drawing trend lines, because it all seems so random. But to your point, if substantial traders are automating their trades based on those levels, then it makes sense that they have some validity. Very eye-opening.
Does anybody know the software or tool Filip is using in his videos to show all those trends and drawing lines?
1 Like
Can anyone help me please, I have been using tradingview for a while now but when i first started using it i was on an old lap top and while viewing the page i was able to get it to take up the whole screen, without the address bar and other tabs being shown. When i got a new lap top a few month ago i could do the same as if it was a app, but since a brave browser update i can seem to view it in any way other than a web page. Thanks in advance.
It called trading view.
I just wanted to point out that today’s (8/1/2020) massive sell off occurred at precisely 9pm PST after today’s pump. Coins include Bitcoin, Eth, Ripple, and ADA, as well as several others. Check out the hourly candles. Looks like the whales had their say today.
Upward and downward trends are mainly a confirmation of the current “health status” of a company, commodity, project etc. in their respective markets. Trends can also apply to markets as a whole, like Filip showed with the S&P 500 example - a good indication of the economy and where it’s likely heading.
To predict how long trends will last is impossible as there are many factors to take into consideration that can set off an immediate change in the trend. Like you point out, news (positive or negative) will definitely shed light on these factors and is the most important thing to watch out for while invested (to maybe sell or add to positions), or waiting to take position.
- Insiders selling or buying
- The state of the economy at large
- Increased/decreased earnings
- Management changes
- New market conditions for a product/service (more or less demand)
These are some examples of potential trend changing triggers to watch out for in the news. However, a trend is likely to stay strong when negative news don’t affect upward trends, and positive news are unable to break negative trends.
Then of course, we have the technical triggers to watch out for. My personal favorites when it comes to spotting possible trend changes long and short term are discrepancies between price and trading volumes, RSI and MACD. I’m sure Filip will touch upon this during this course.
1 Like
Filip presented new way of looking at candlesticks for me and how they can fit in or change a trend …thanks
1 Like