I think the blockquotes messed up the formatting… maybe try this? I can’t find an option to upload a txt file…that would be handy.
//@version=3
// Original Author: @JayRogers
// Revision Author: JustUncleL
// Revision Author: HeCormier
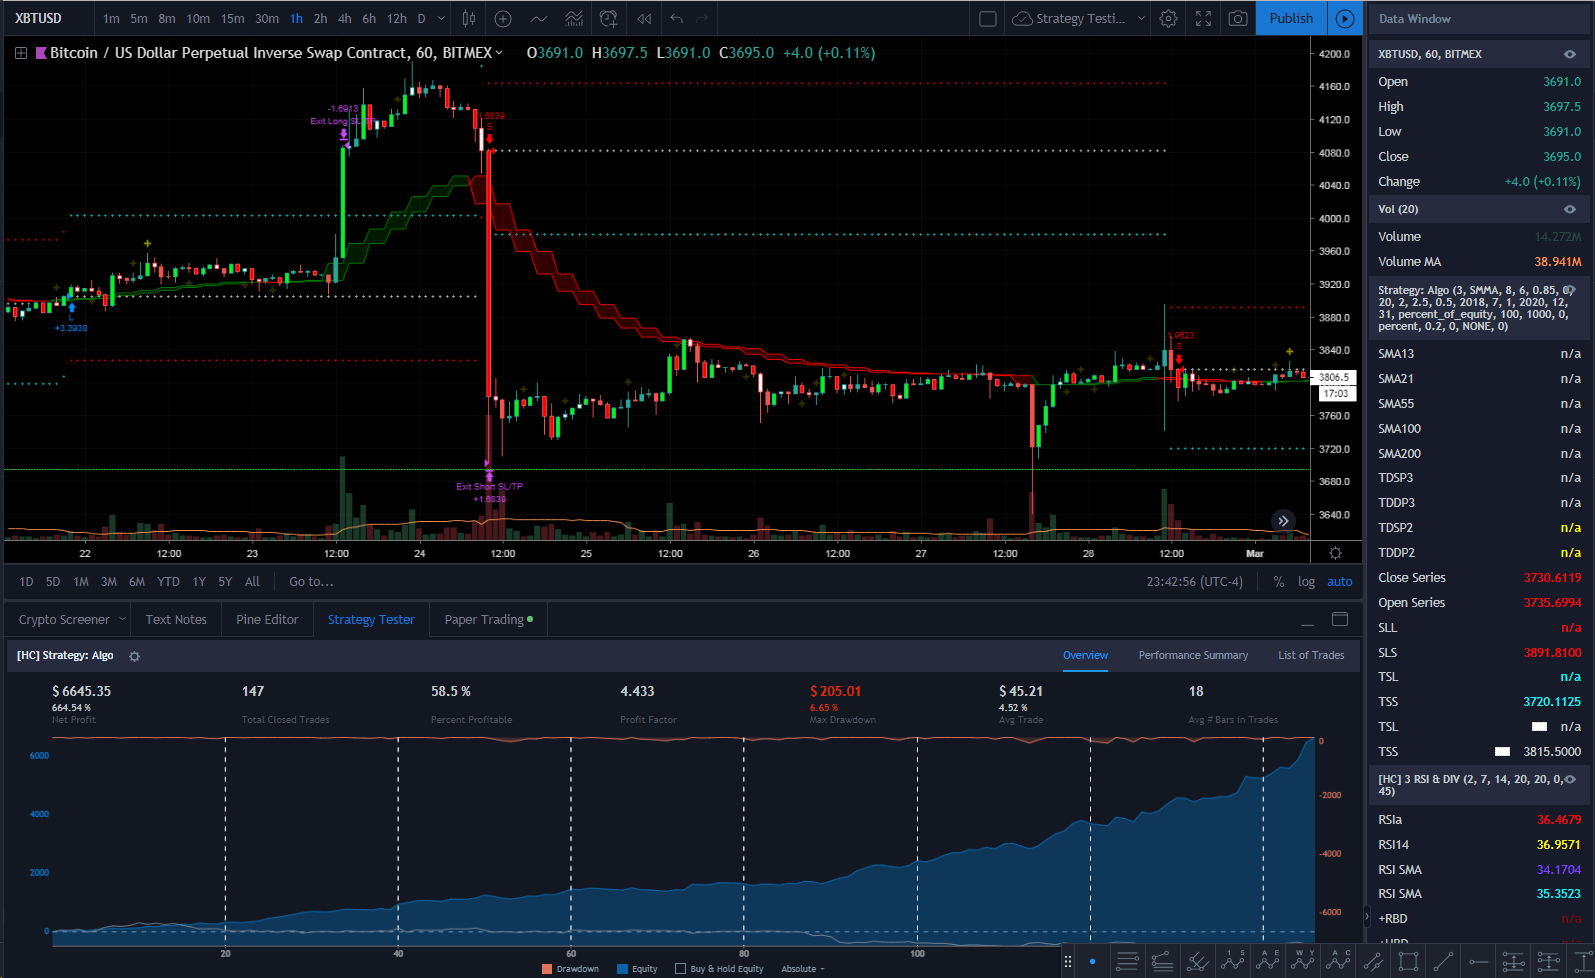
strategy("[HC] Strategy: Algo", shorttitle=“Strategy: Algo”, overlay=true,
default_qty_type=strategy.percent_of_equity, default_qty_value=100, initial_capital=1000,
calc_on_order_fills= true, calc_on_every_tick=true, max_bars_back=10,
pyramiding=0,commission_type=strategy.commission.percent,commission_value=0.2)
src = close
//* General Inputs //
showTrendCloud = input(title=“Show TrendCloud?”, type=bool, defval=true) // Plot Trend Cloud //
showRBDDBRColor = input(title=“Show RBR DBD Candle Colors?”, type=bool, defval=true) // RBD (Rally Base Drop) & DBR (Drop Base Rally) Candle Colors //
showTDLevelPoints = input(title=“Show TDSP/TDDP?”, type=bool, defval=true) // * TD Level Points * //
showSMA = input(title=“Show SMA?”, type=bool, defval=false) // * Simple Moving Averages * //
showPositionLevels = input(title=“Show Position Levels?”, type=bool, defval=true) // Plot Order, Stop Loss and Trailing Stop Trigger Levels *//
//* Simple Moving Averages *//
ma12 = na
ma12 := sma(src, 13)
ma21 = na
ma21 := sma(src, 21)
ma55 = na
ma55 := sma(src, 55)
ma89 = na
ma89 := sma(src, 89)
ma200 = na
ma200 := sma(src, 200)
plot(showSMA ? ma12 : na, color=red, transp=0, style=line, title=“SMA13”, linewidth=1)
plot(showSMA ? ma21 : na, color=yellow, transp=0, style=line, title=“SMA21”, linewidth=1)
plot(showSMA ? ma55 : na, color=lime, transp=0, style=line, title=“SMA55”, linewidth=1)
plot(showSMA ? ma89 : na, color=aqua, transp=0, style=line, title=“SMA100”, linewidth=1)
plot(showSMA ? ma200 : na, color=purple, transp=0, style=line, title=“SMA200”, linewidth=1)
//* RBD (Rally Base Drop) & DBR (Drop Base Rally) Candle Colors *//
cR = (close - open) >= 0 ? ((close - open) / (high - low))*100 > 50 ? true : false : na //Rally Candle
cB = (abs(close - open) / (high - low))*100 < 50 ? true : false //Base Candle
cD = (open - close) >= 0 ? ((open - close) / (high - low))*100 > 50 ? true : false : na //Drop Candle
limeBar = cR
whiteBar = (cR[1] and cB) or (cD[1] and cB)
redBar = cD
barcolor(showRBDDBRColor ? limeBar ? lime : na : na)
barcolor(showRBDDBRColor ? whiteBar ? white : na : na)
barcolor(showRBDDBRColor ? redBar ? red : na : na)
// * TD Level Points * //
TDSP1 = high < high[1] and high[1] > high[2]
TDSP2 = high < high[1] and high[1] < high[2] and high[2] > high[3] and high[3] > high[4]
TDSP3 = high < high[1] and high[1] < high[2] and high[2] < high[3] and high[3] > high[4] and high[4] > high[5] and high[5] > high[6]
TDDP1 = low > low[1] and low[1] < low[2]
TDDP2 = low > low[1] and low[1] > low[2] and low[2] < low[3] and low[3] < low[4]
TDDP3 = low > low[1] and low[1] > low[2] and low[2] > low[3] and low[3] < low[4] and low[4] < low[5] and low[5] < low[6]
plotshape(showTDLevelPoints ? TDSP3 ? TDSP3 : na : na, title= “TDSP3”, color=yellow, transp=40, size=size.tiny, style=shape.cross, location=location.abovebar, offset=-3)
plotshape(showTDLevelPoints ? TDDP3 ? TDDP3 : na : na, title= “TDDP3”, color=yellow, transp=40, size=size.tiny, style=shape.cross, location=location.belowbar, offset=-3)
plotshape(showTDLevelPoints ? TDSP2 ? TDSP2 : na : na, title= “TDSP2”, color=yellow, transp=80, size=size.tiny, style=shape.cross, location=location.abovebar, offset=-4)
plotshape(showTDLevelPoints ? TDDP2 ? TDDP2 : na : na, title= “TDDP2”, color=yellow, transp=80, size=size.tiny, style=shape.cross, location=location.belowbar, offset=-4)
//* Algo Strategy Inputs //
inpDescriptionStrategy = input(defval=true, title = “Strategy Settings”)
useRes = input(defval = true, title = “Use Alternate Resolution?”)
intRes = input(defval = 3, title = “Multiplier for Alernate Resolution”)
stratRes = ismonthly? tostring(intervalintRes,"###M") : isweekly? tostring(intervalintRes,"###W") : isdaily? tostring(intervalintRes,"###D") : isintraday ? tostring(interval*intRes,"####") : ‘60’
basisType = input(defval = “SMMA”, title = "Basis Moving Average Type: ", options=[“SMA”, “EMA”, “DEMA”, “TEMA”, “WMA”, “VWMA”, “SMMA”, “HullMA”, “LSMA”, “ALMA”, “SSMA”, “TMA”])
basisLen = input(defval = 8, title = “MA Period”, minval = 1)
offsetSigma = input(defval = 6, title = “Offset for LSMA / Sigma for ALMA”, minval = 0)
offsetALMA = input(defval = 0.85, title = “Offset for ALMA”, minval = 0, step = 0.01)
delayOffset = input(defval = 0, title = “Delay Open/Close MA (Forces Non-Repainting)”, minval = 0, step = 1)
cloudSpread = input(defval = 1, title=“Cloud Spread Trigger”, minval = 0)
//* Return MA Input Selection //
variant(type, src, len, offSig, offALMA) =>
v1 = sma(src, len) // Simple
v2 = ema(src, len) // Exponential
v3 = 2 * v2 - ema(v2, len) // Double Exponential
v4 = 3 * (v2 - ema(v2, len)) + ema(ema(v2, len), len) // Triple Exponential
v5 = wma(src, len) // Weighted
v6 = vwma(src, len) // Volume Weighted
v7 = 0.0
v7 := na(v7[1]) ? sma(src, len) : (v7[1] * (len - 1) + src) / len // Smoothed
v8 = wma(2 * wma(src, len / 2) - wma(src, len), round(sqrt(len))) // Hull
v9 = linreg(src, len, offSig) // Least Squares
v10 = alma(src, len, offALMA, offSig) // Arnaud Legoux
v11 = sma(v1,len) // Triangular (extreme smooth)
// SuperSmoother filter
// © 2013 John F. Ehlers
a1 = exp(-1.4143.14159 / len)
b1 = 2a1cos(1.4143.14159 / len)
c2 = b1
c3 = (-a1)a1
c1 = 1 - c2 - c3
v12 = 0.0
v12 := c1(src + nz(src[1])) / 2 + c2nz(v12[1]) + c3*nz(v12[2])
type==“EMA”?v2 : type==“DEMA”?v3 : type==“TEMA”?v4 : type==“WMA”?v5 : type==“VWMA”?v6 : type==“SMMA”?v7 : type==“HullMA”?v8 : type==“LSMA”?v9 : type==“ALMA”?v10 : type==“TMA”?v11: type==“SSMA”?v12: v1
//* Security Wrapper for Alternate Resolution *//
reso(exp, use, res) => use ? security(tickerid, res, exp, gaps=barmerge.gaps_off, lookahead=barmerge.lookahead_on) : exp
//* Plot Trend Cloud *//
closeSeries = variant(basisType, close[delayOffset], basisLen, offsetSigma, offsetALMA)
openSeries = variant(basisType, open[delayOffset], basisLen, offsetSigma, offsetALMA)
closeSeriesAlt = reso(closeSeries, useRes, stratRes)
openSeriesAlt = reso(openSeries, useRes, stratRes)
trendColor = (closeSeriesAlt > openSeriesAlt) ? green : red
closeP=plot(showTrendCloud ? closeSeriesAlt : na, title = “Close Series”, color = trendColor, linewidth = 1, style = line, transp = 1)
openP=plot(showTrendCloud ? openSeriesAlt : na, title = “Open Series”, color = trendColor, linewidth = 1, style = line, transp = 1)
fill(closeP,openP,color=trendColor,transp=80)
// *** Strategy Long/Short Call Calculation ***
longEntry = na
shortEntry = na
inLongPosition = na
inShortPosition = na
flat = na
inLongPosition := longEntry[1] ? true : shortEntry[1] ? false : inLongPosition[1]
inShortPosition:= shortEntry[1] ? true : longEntry[1] ? false : inShortPosition[1]
flat := not inLongPosition and not inShortPosition
xlong = cross(closeSeriesAlt, openSeriesAlt) and closeSeriesAlt > openSeriesAlt
xshort = cross(closeSeriesAlt, openSeriesAlt) and closeSeriesAlt < openSeriesAlt
longEntry := xlong[1] and abs(openSeriesAlt - closeSeriesAlt) > cloudSpread
shortEntry := xshort[1] and abs(openSeriesAlt - closeSeriesAlt) > cloudSpread
// *** STRATEGY *** //
//Variables declarations
inpDescriptionPosition = input(defval=true, title = “Strategy Position Settings”) // Settings Header
inpTakeProfit = input(defval = 20, title = “Take Profit %”, minval = 0)
inpStopLoss = input(defval = 2, title = “Stop Loss %”, minval = 0)
inpTrailStop = input(defval = 2.5, title = “Trailing Stop Loss %”, minval = 0)
inpTrailOffset = input(defval = 0.5, title = “Trailing Stop Loss Offset %”, minval = 0)
procent = 0.0
openprice = 0.0
curprice = close[0]
useTakeProfit = 0.0
useStopLoss = 0.0
useTrailStop = 0.0
useTrailOffset = 0.0
openprice := nz(openprice[1])
useTakeProfit := nz(useTakeProfit[1])
useStopLoss := nz(useStopLoss[1])
useTrailStop := nz(useTrailStop[1])
useTrailOffset := nz(useTrailOffset[1])
useTakeProfit := useTakeProfit==0.0 ? na : useTakeProfit
useStopLoss := useStopLoss==0.0 ? na : useStopLoss
useTrailStop := useTrailStop==0.0 ? na : useTrailStop
useTrailOffset := useTrailOffset==0.0 ? na : useTrailOffset
openprice := openprice==0.0 ? na : openprice
// Date and Time Backtest Ranges
inpDescriptionBacktest = input(defval=true, title = “Strategy Backtest Range Settings”)
st_yr_inp = input(defval=2018, title=‘Backtest Start Year’, type=integer)
st_mn_inp = input(defval=07, title=‘Backtest Start Month’, type=integer)
st_dy_inp = input(defval=01, title=‘Backtest Start Day’, type=integer)
en_yr_inp = input(defval=2020, title=‘Backtest End Year’, type=integer)
en_mn_inp = input(defval=12, title=‘Backtest End Month’, type=integer)
en_dy_inp = input(defval=31, title=‘Backtest End Day’, type=integer)
// Set start and end dates for backtest
start = timestamp(st_yr_inp, st_mn_inp, st_dy_inp,23,59)
end = timestamp(en_yr_inp, en_mn_inp, en_dy_inp,23,59)
testDateRange = time > start and time < end
// Long Strategy
if (longEntry and testDateRange and (strategy.position_size==0 or inShortPosition))
openprice := close[0]
procent := nz((curprice/100)(1/syminfo.mintick))
useTakeProfit := inpTakeProfit >= 1 ? inpTakeProfitprocent : na
useStopLoss := inpStopLoss >= 1 ? inpStopLossprocent : na
useTrailStop := inpTrailStop >= 1 ? inpTrailStopprocent : na
useTrailOffset := inpTrailOffset >= 1 ? inpTrailOffset*procent : na
strategy.entry(‘L’,strategy.long)
strategy.exit(“Exit Long SL/TP”, from_entry = “L”, profit = useTakeProfit, loss = useStopLoss, trail_points = useTrailStop, trail_offset = useTrailOffset)
// Short Strategy
if (shortEntry and testDateRange and (strategy.position_size==0 or inLongPosition))
openprice := close[0]
procent := nz((curprice/100)(1/syminfo.mintick))
useTakeProfit := inpTakeProfit >= 1 ? inpTakeProfitprocent : na
useStopLoss := inpStopLoss >= 1 ? inpStopLossprocent : na
useTrailStop := inpTrailStop >= 1 ? inpTrailStopprocent : na
useTrailOffset := inpTrailOffset >= 1 ? inpTrailOffset*procent : na
strategy.entry(‘S’,strategy.short)
strategy.exit(“Exit Short SL/TP”, from_entry = “S”, profit = useTakeProfit, loss = useStopLoss, trail_points = useTrailStop, trail_offset = useTrailOffset)
//* Plot Order, Stop Loss and Trailing Stop Trigger Levels //
plot(showPositionLevels ? inLongPosition ? openprice[0]-(useStopLosssyminfo.mintick) : na : na,color=red,style=cross, linewidth=1, title=‘SLL’)
plot(showPositionLevels ? inShortPosition ? openprice[0]+(useStopLosssyminfo.mintick) : na : na,color=red,style=cross, linewidth=1, title=‘SLS’)
plot(showPositionLevels ? inLongPosition ? openprice[0]+(useTrailStopsyminfo.mintick) : na : na,color=aqua,style=cross, linewidth=1, title=‘TSL’)
plot(showPositionLevels ? inShortPosition ? openprice[0]-(useTrailStop*syminfo.mintick) : na : na,color=aqua,style=cross, linewidth=1, title=‘TSS’)
plot(showPositionLevels ? inLongPosition ? openprice[0] : na : na,color=white,style=cross, linewidth=1, title=‘TSL’)
plot(showPositionLevels ? inShortPosition ? openprice[0] : na : na,color=white,style=cross, linewidth=1, title=‘TSS’)