Reading Assignment: Strategy Improvements

@filip for the qty argument in the strategy.entry function, is there a way we can set this qty to be a percentage of our initial capital?

Or, are there any other ways we can tweak this? I noticed that at lower initial capital, I can tweak the strategy to be more profitable than buy & hold, but at higher initial capital, because the BTC price is cheaper the further back we go in the timeline, the buy & hold calculation is based on investing 100% of the initial capital.

Therefore, if we’re only buying 0.1/0.2 BTC per trade at the beginning, we’re not utilizing our entire capital to investment.

Thanks!

1 Like

Nevermind, you covered this in the next section! @filip

1 Like

Well I messed up here didnt get it to work, will need alot of time testing this out. So I continue
with the rest of the lessons. Will post it here as soon as I figure this out.

Unfortunately, it is not possible to test my script with @filip data set and compare it to his results ,because it is not possible to use data before 2019.
Here is my code:

strategy(title="Beat Filip", overlay=true, initial_capital=2000, commission_type=strategy.commission.percent, commission_value=0.2)

fromMonth=input(defval=1, title="from Month",minval=1)
fromDay=input(defval=1, title="from Day",minval=1)
fromYear=input(defval=2019, title="from Year",minval=2014)

toMonth=input(defval=1, title="to Month",minval=1)
toDay=input(defval=4, title="to Day",minval=1)
toYear=input(defval=2019, title="to Year",minval=2014)

shortMa=ema(close,25)
longMa=ema(close,60)

timeInRange=(time > timestamp(fromYear, fromMonth, fromDay, 00, 00)) and (time < timestamp(toYear, toMonth, toDay, 23, 59))

longSignal=if ((close>open) and ((open-low)>100)) and timeInRange
    true
else
    crossover(shortMa,longMa) and timeInRange

shortSignal = if ((open>close) and ((high-open)>100) and (close[1]>open[1] )) and timeInRange
    true
else
    crossover(longMa,shortMa) and timeInRange

strategy.entry(id="longPosition", long=true, qty=0.1, when=longSignal)
strategy.entry(id="shortPosition", long=false,qty=0.1, when=shortSignal)

Here are my results. I tested my code with 4 data sets:
01.01.2019-01.04.2019
01.04.2019-01.07.2019
01.07.2019-01.10.2019
01.10.2019-31.12.2019
First: 01.01.2019-01.04.2019


–> Lost 20 $, but during this phase there was nearly no big trading activity (means sideways for this three month; I have to modify my code in order to detect such a sideway trading activity and use a different algorithm fr these trading weeks.)

Second data set: 01.04.2019-01.07.2019

Third: 01.07.2019-01.10.2019

Forth:01.10.2019-31.12.2019

I think, it is quite OK. Just need an update for detecting sideway trading phases.

1 Like

I have tweaked short ma to 20 and long ma to 70. The long and short signals also included RSI indicating “not oversold” or “not overbought”.

The three datasets include only 2019 because I’m a free user:
1/1/2019 to 30/6/2019

1/7/2019 to 31/12/2019

1/1/2019 to 31/12/2019

//@version=4
strategy(title=“MA Crossing Strategy”, overlay=true, initial_capital=2000, commission_type=strategy.commission.percent, commission_value=0.2)

vol = input(defval = 300, title=“volume”, minval = 1)

shma = input(defval = 21, title = “short ma”, minval = 1)
lnma = input(defval = 50, title = “long ma”, minval = 1)

fromMo = input(defval = 1, title=“from month”, minval = 1)
fromDay = input(defval = 1, title=“from day”, minval = 1)
fromYo = input(defval = 2019, title=“from year”, minval = 2012)

toMo = input(defval = 1, title=“to month”, minval = 1)
toDay = input(defval = 1, title=“to day”, minval = 1)
toYo = input(defval = 2022, title=“to year”, minval = 2012)

short = sma(close, shma)
long = sma(close, lnma)

fast = 12, slow = 26
fastMA = ema(close, fast)
slowMA = ema(close, slow)
macd = fastMA - slowMA

timeInRange=(time > timestamp(fromYo, fromMo, fromDay, 00, 00)) and (time < timestamp(toYo, toMo, toDay,23,59))

longSignal = crossover(short, long) and macd < 1 and timeInRange and volume > 400

shortSignal = crossover(long, short) and timeInRange and volume > 400

//Position
strategy.entry(id=“longPosition”, long=true, qty=0.1,when=longSignal, comment=“buy”)
strategy.entry(id=“longPosition”, long=false, qty=0.1, when=shortSignal, comment=“sell” )

I have used a combination of indicators including RSI, Volume and the 40MA and 80MA.

The objective was to avoid lots of small trades and to try and catch the peeks and troughs of each cycle for larger trades.

Trading View seems to limit the data set to1.5yrs on hourly charts (even though I have a PRO+ account). So I used the full 1.5yr data set from one exchange and for out testing I used the data set from a different exchange.

The main change I had to make when swapping exchanges was the volume; some exchanges have greater volume than others. However, this should not be considered to be curve fitting as the volume is a characteristic of the exchange and can be predicted in advance.

1 Like

Not a huge money maker, maybe, but here’s three data sets with over 2 profit factor and around 50% profitable.

at first, I was trying to make 1m trades but commissions got too expensive. I switched my trading to 4h and that seemed to work better.

1 Like

5000 initial capital

My first test periode is from 1/1/2017 … now, i wanted to see if the result is positive overall.
Then i took all 2018 as test because of the down trend.

the result is also a screenshot

The 3e test was from 2018 until now :

The 1e image now with the result :

My script is based on the MACD indicator (12,16,9)

=======================================================================
// This source code is subject to the terms of the Mozilla Public License 2.0 at https://mozilla.org/MPL/2.0/

//@version=4
strategy(“RLion MACD Strategy”, overlay=true, initial_capital=2000, commission_type=strategy.commission.percent, commission_value=0.2)

//DATE AND TIME
fromMonth = input(defval=1, title = “from month”, minval=1)
fromDay = input(defval=1, title = “from day”, minval=1)
fromYear = input(defval=2019, title = “from year”, minval=2014)

toMonth = input(defval=1, title = “to month”, minval=1)
toDay = input(defval=1, title = “to day”, minval=1)
toYear = input(defval=2025, title = “to year”, minval=2014)

timerange = (time > timestamp(fromYear, fromMonth, fromDay, 00, 00 )) and (time < timestamp(toYear, toMonth, toDay, 23, 59))

fastLength = input(12)
slowlength = input(26)
MACDLength = input(9)

MACD = ema(close, fastLength) - ema(close, slowlength)
aMACD = ema(MACD, MACDLength)
delta = MACD - aMACD

if (crossover(delta, 0)) and timerange
strategy.entry(“MacdLE”, strategy.long, comment=“Buy”)

if (crossunder(delta, 0)) and timerange
strategy.entry(“MacdLE”, strategy.short, comment=“Sell”)

I could only test this from 1/2/18 - current…I simply added RSI parameters and a stop loss exit clauses for profit and loss. The moving averages that seemed to work best were 81 and 100…

I would really like to refine further and learn how to integrate more parameters.

Tried similar strategy that you did. Tried different moving averages at different time frames. Some worked very well, and some very bad. It was very good for learning, to be able to adjust and click around to see how it all works. So excited to become better at this!

strategy(title=“CryptoTradingBot1”, overlay=true, initial_capital=2000, commission_type=strategy.commission.percent, commission_value=0.2)
plot(close)

// DATE AND TIME
fromMonth = input(defval=5, title= “From month”, minval=1)
fromDay = input(defval=1, title= “From day”, minval=1)
fromYear = input(defval=2019, title= “From year”, minval=2014)

toMonth = input(defval=7, title= “To month”, minval=1)
toDay = input(defval=1, title= “To day”, minval=1)
toYear = input(defval=2019, title= “To year”, minval=2014)

// DEFINITIONS
shortMa = sma(close, 70)
longMa = sma(close, 145)

// LOGIC
timeInRange = (time > timestamp(fromYear, fromMonth, fromDay, 00, 00)) and (time < timestamp(toYear, toMonth, toDay, 23, 59))
longSignal = crossover(shortMa, longMa) and timeInRange
shortSignal = crossover(longMa, shortMa) and timeInRange

// POSITIONS
strategy.entry(id=“longPosition”, long=true, qty=0.1, when=longSignal)
strategy.entry(id=“shortPosition”, long=false, qty=0.1, when=shortSignal)

Seemed to work better on some data sets more than others but generally stayed net positive. I want to make the algorithm “sense its surroundings” more and not be so acutely responsive. Like responding to a ripple in time before a tidlewave. Would also be interesting to cross indication strategies to refine “good trades”

//@version=4
strategy(title="Moving Average Crossing", overlay=true, initial_capital=5000, commission_type="strategy.commission.percent", commission_value=0.2)

//DATE AND TIME
fromMonth = input(defval=1, title="From month", minval=1)
fromDay = input(defval=1, title="From day", minval=1)
fromYear = input(defval=2019, title="From year", minval=2014)

toMonth = input(defval=1, title="To month", minval=1)
toDay = input(defval=1, title="To day", minval=1)
toYear = input(defval=2025, title="To year", minval=2014)

//Definitions
shortMa = sma(close, 50)
longMa = sma(close, 120)
s = sar(0.2,0.2,0.2)

//LOGIC
timeInRange = (time > timestamp(fromYear, fromMonth, fromDay, 00, 00)) and (time < timestamp(toYear, toMonth, toDay, 23, 59))
longSignal = crossover(shortMa, longMa) and timeInRange and s < close
shortSignal = crossover(longMa, shortMa) and timeInRange and s > close

//POSITIONS
strategy.entry(id="longPosition", long=true, qty=0.5, when=longSignal)
strategy.entry(id="shortPosition", long=false, qty=0.5, when=shortSignal)


Just a simple rsi crossing the 70 and 30 to represent over and undersold points. I tried to create a 34EMA with “grab candles” but struggled with a few areas. Going to work on that over the next few days.

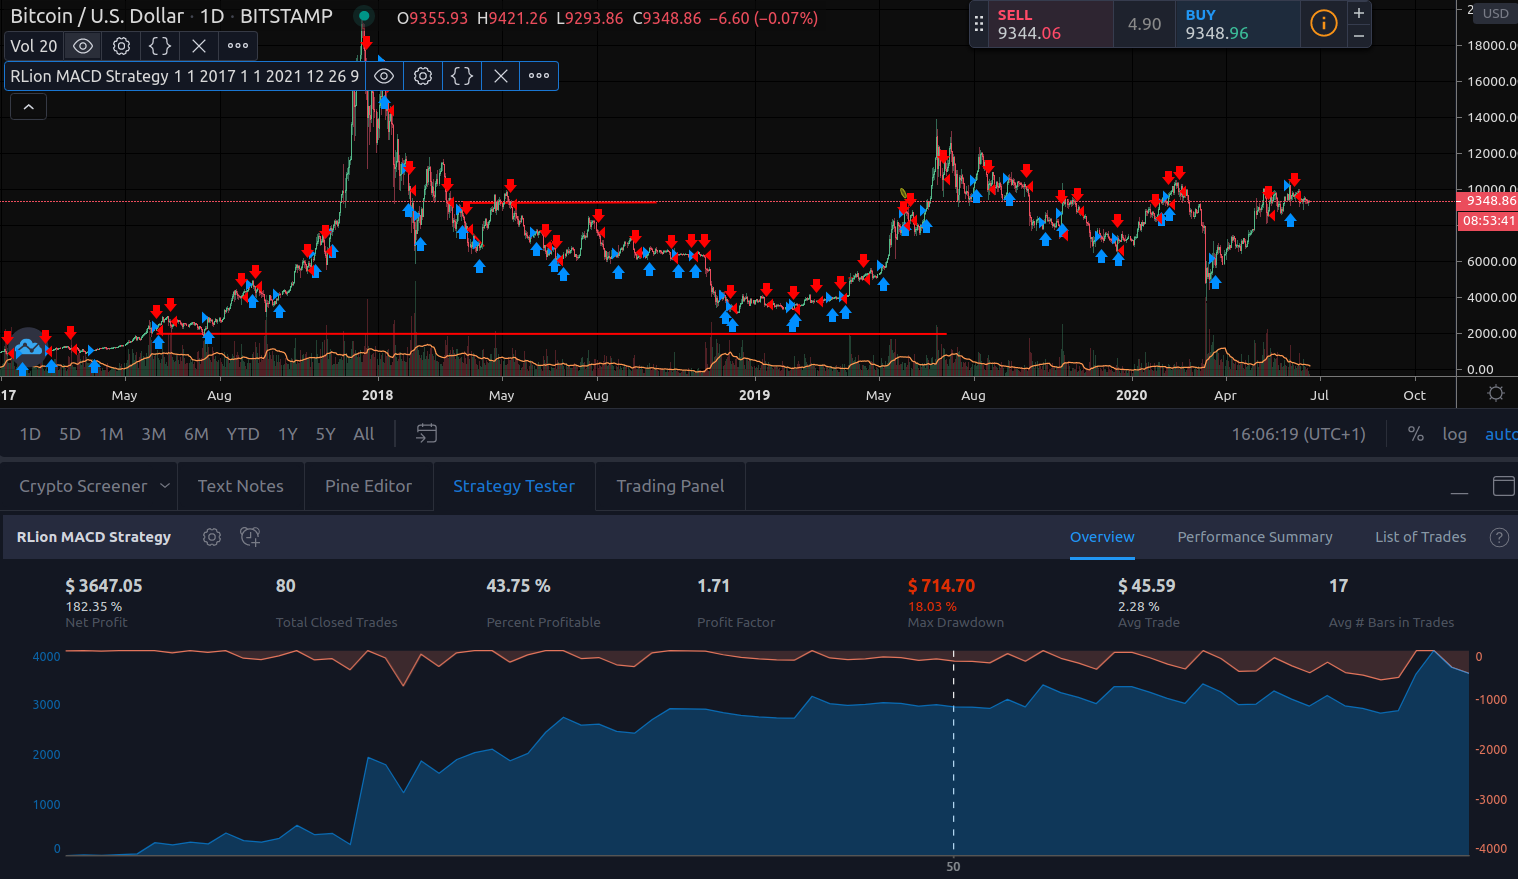
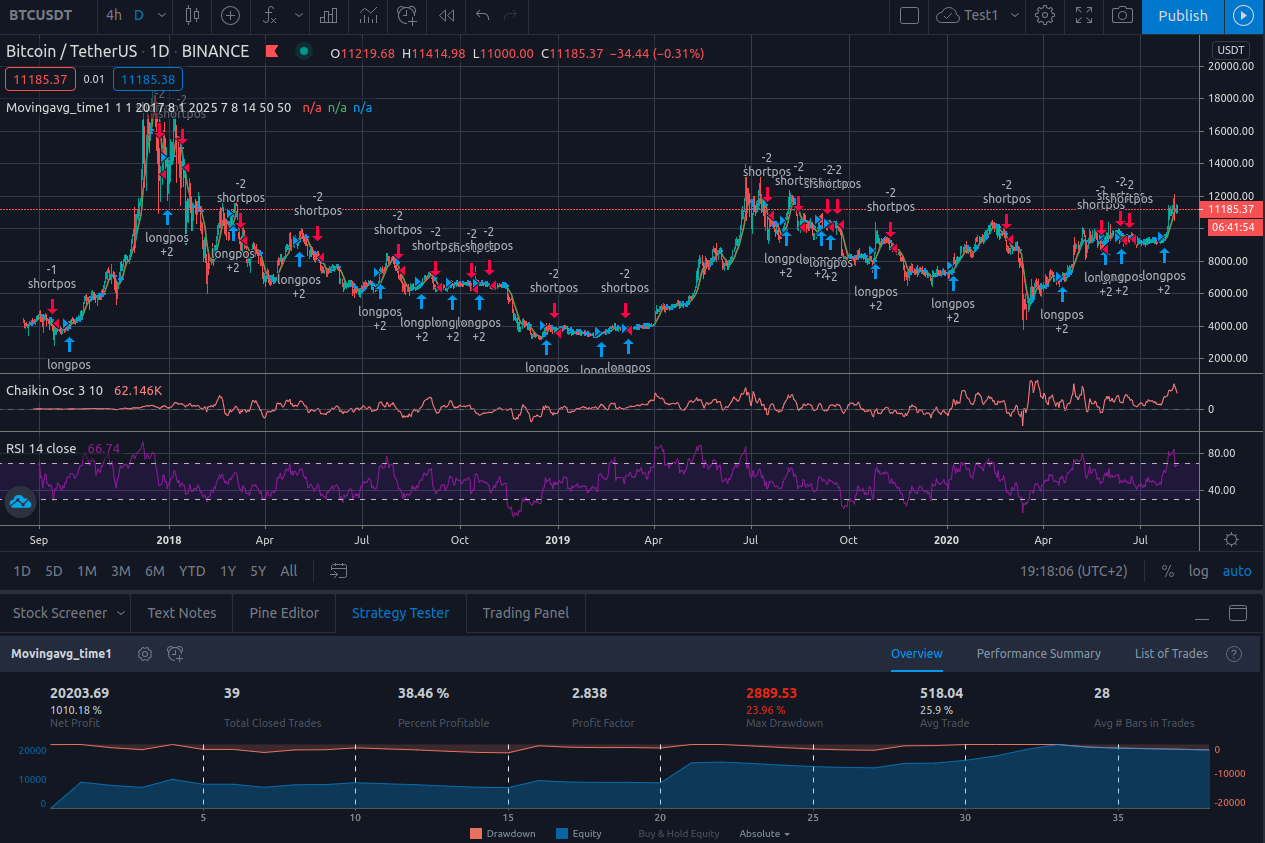
had to use a pyramiding value of 2 to actually get it to execute, USD base currency, and commission based on % of each trade
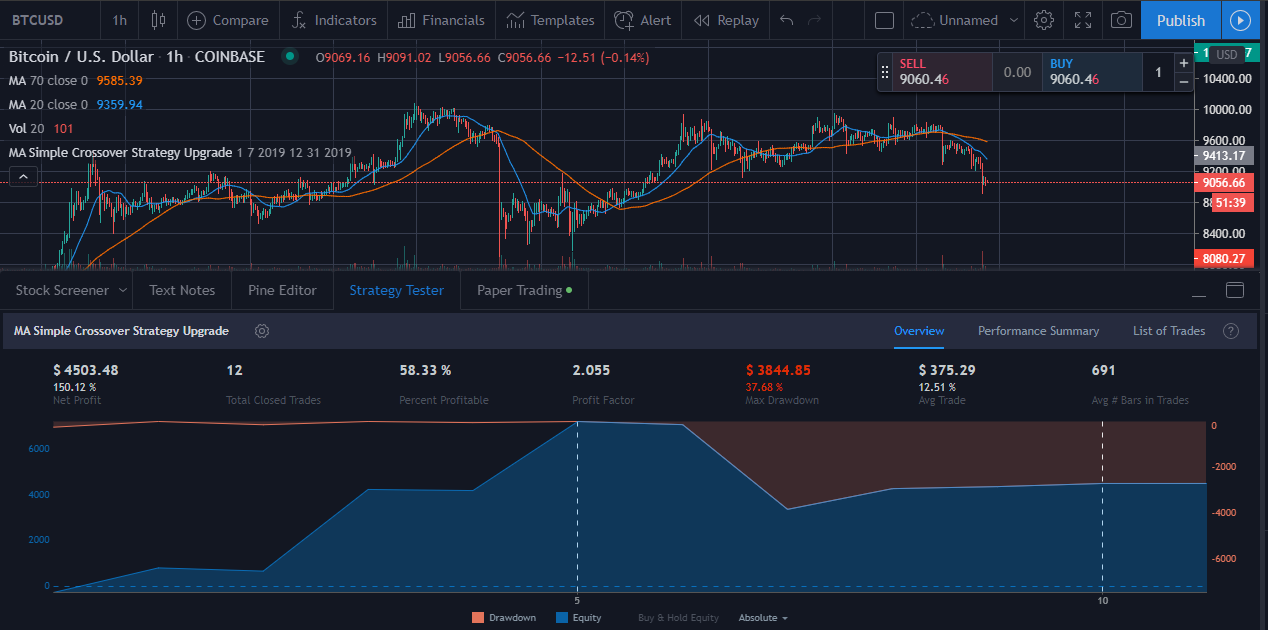
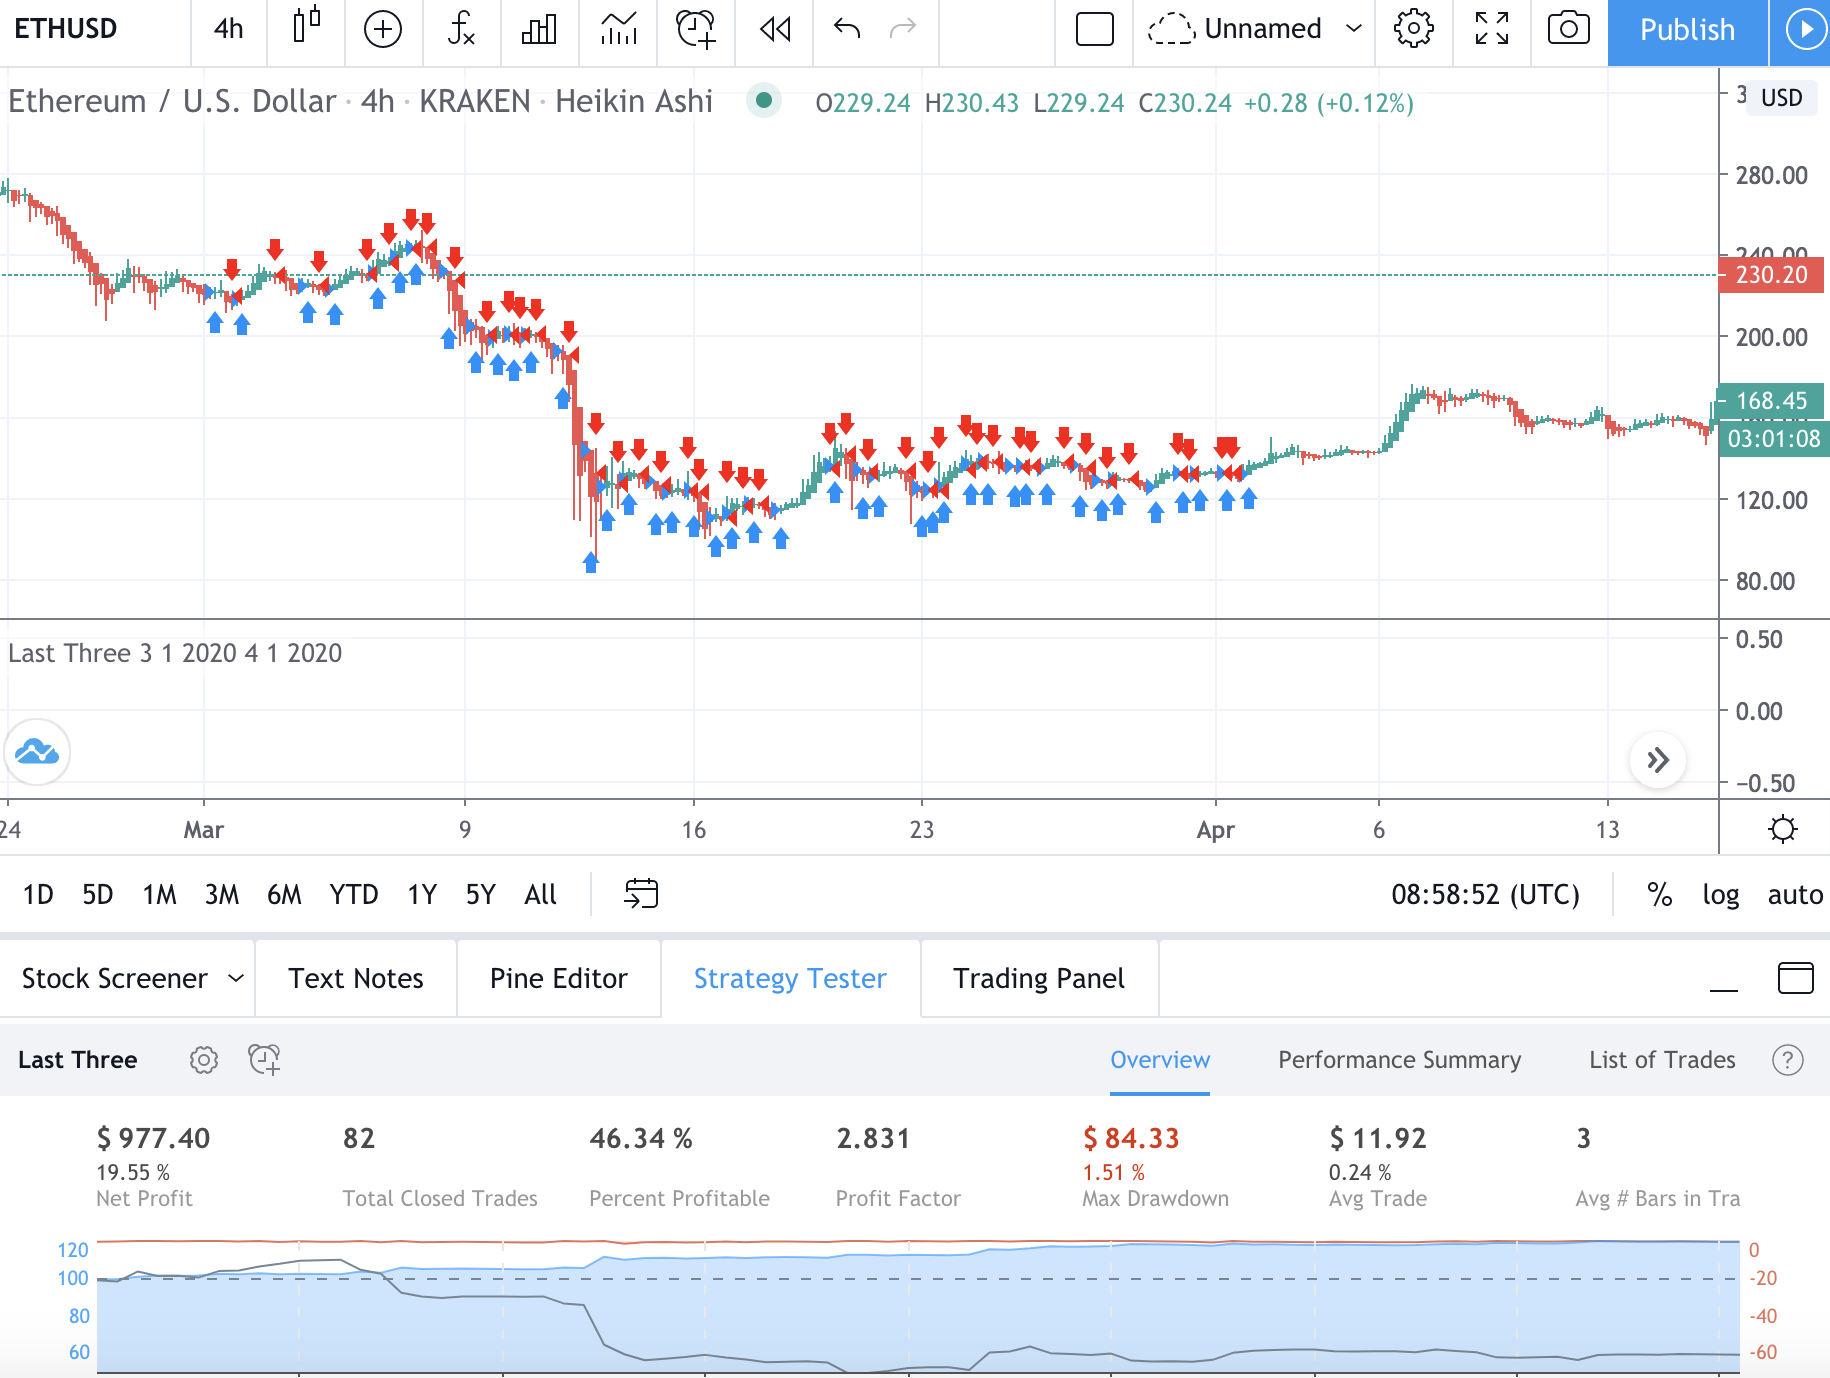
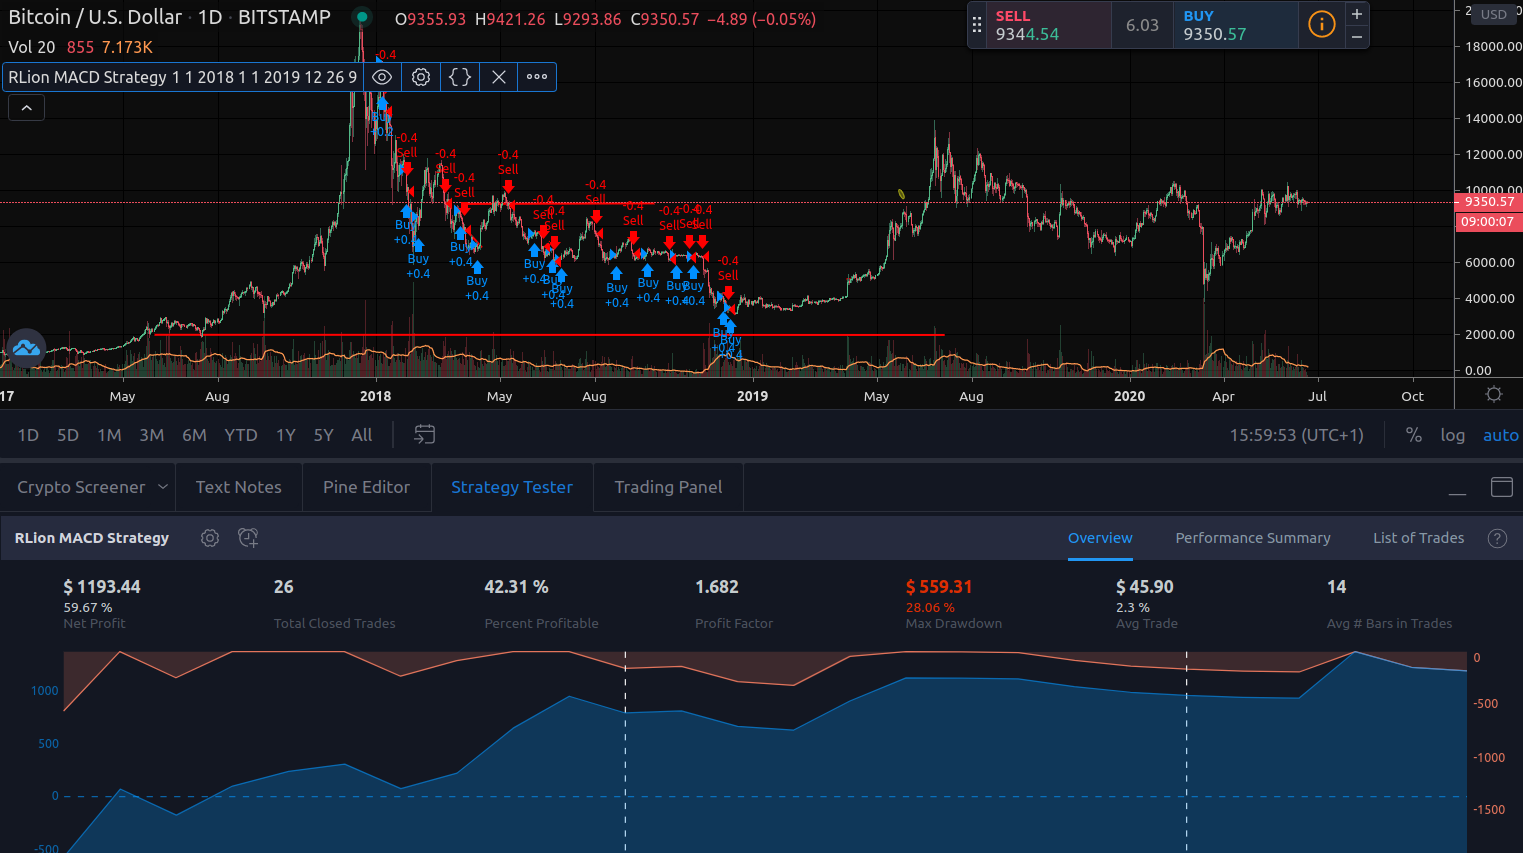
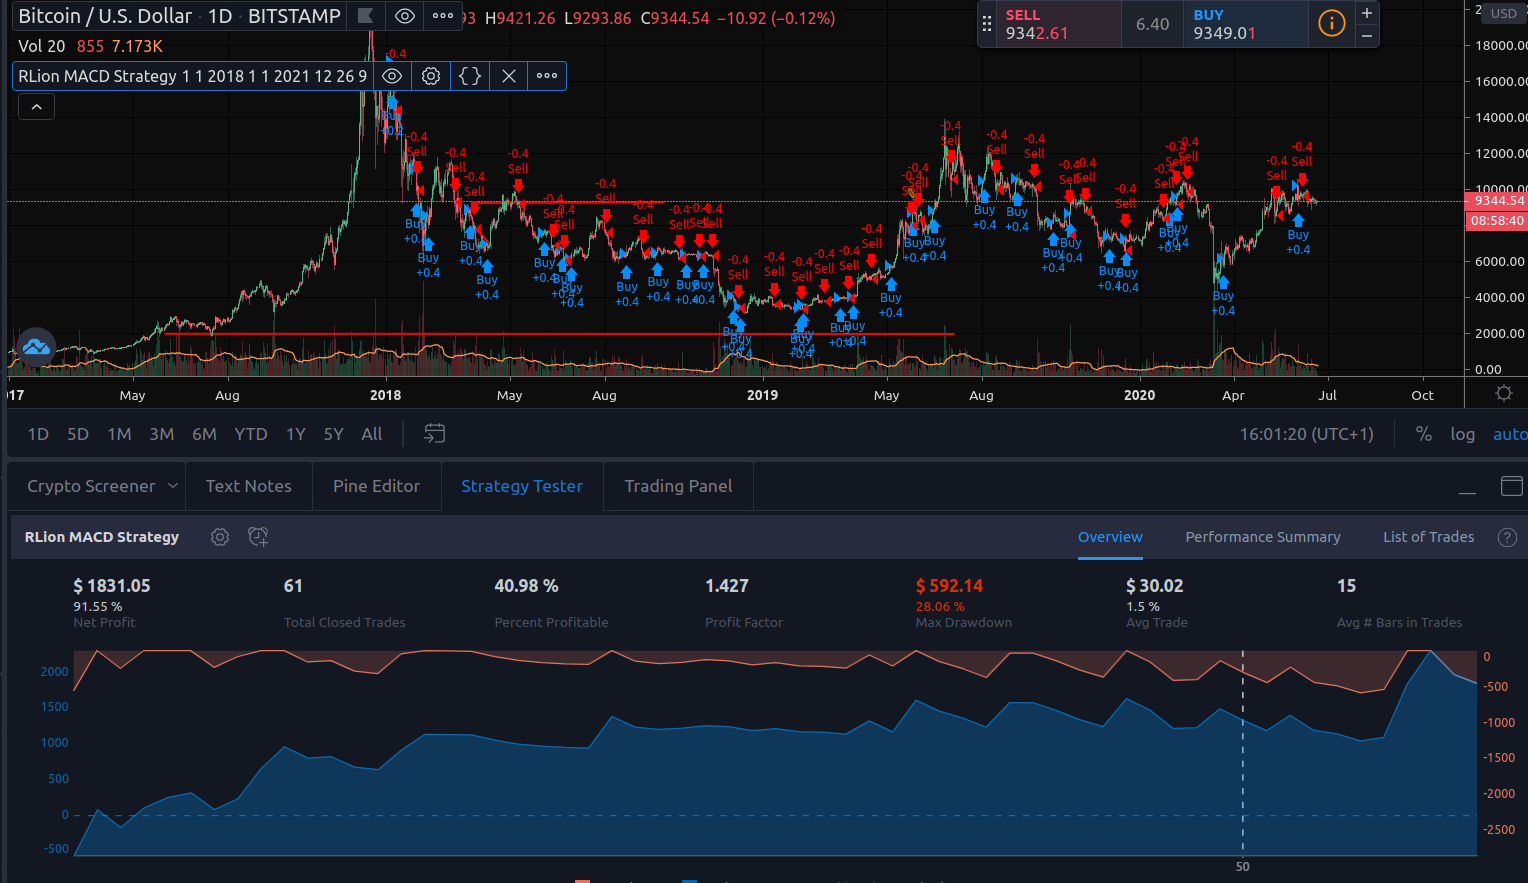
net profit $ 11,511.17, $5,778.47 max draw 43% ouch, 20 closing trades, 50% POP

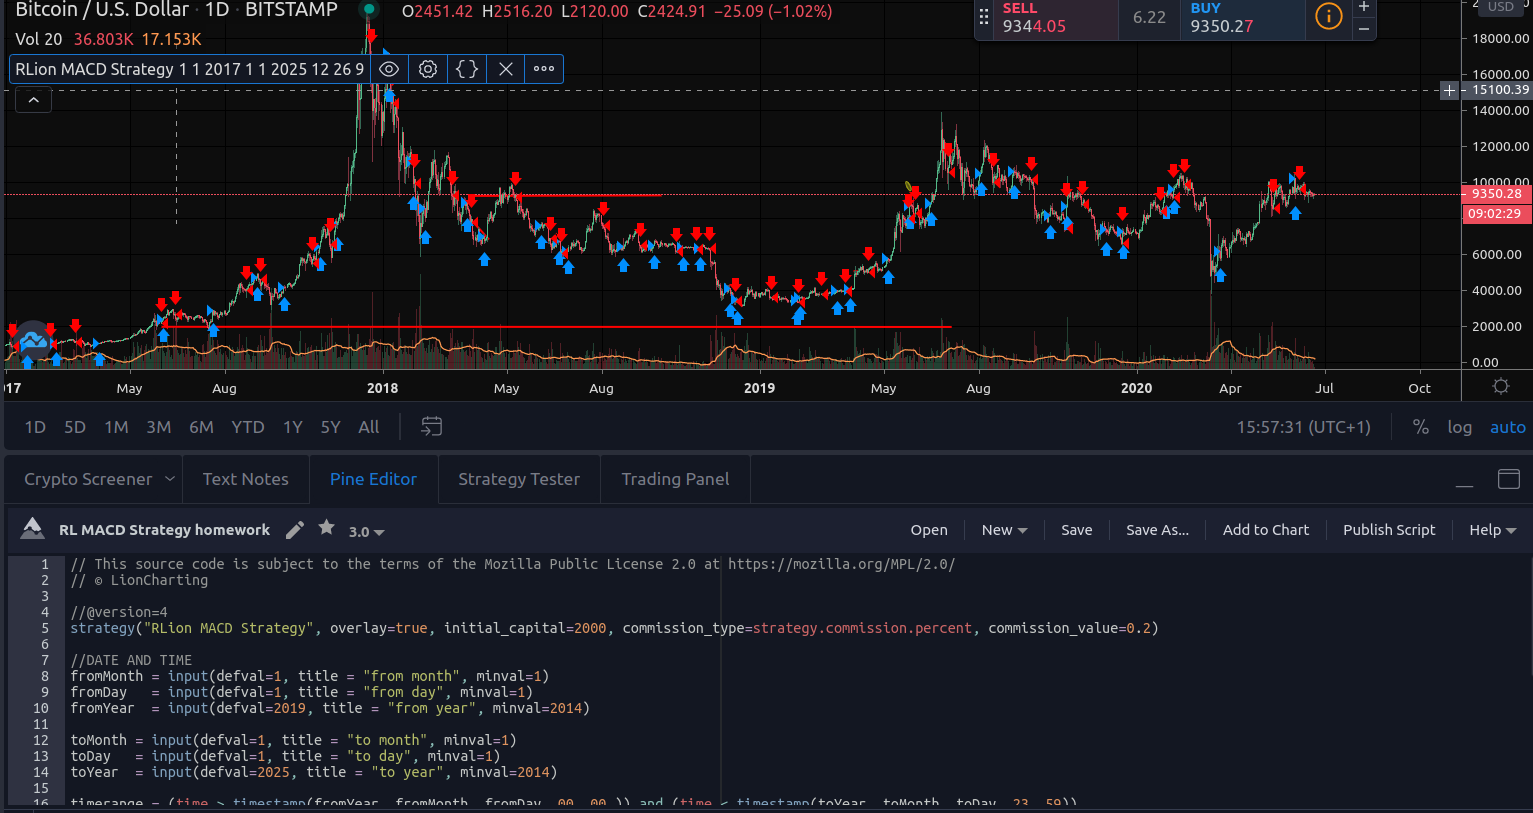
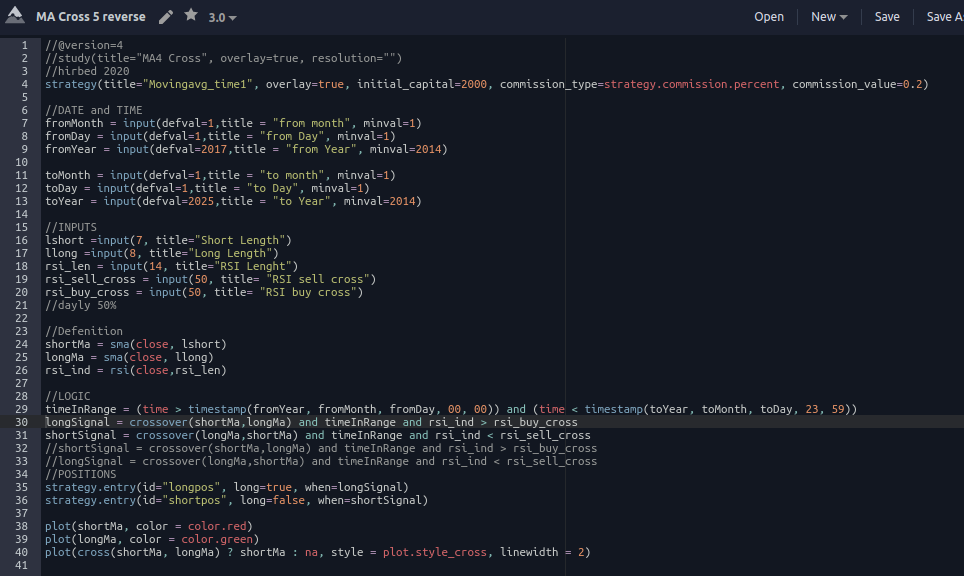
strategy(title =“Moving Avg Crossover”, overlay = true, initial_capital = 2000, commission_type = strategy.commission.percent, commission_value = 0.2)

//date and time

fromDay = input(defval=1, title = “from Day”, minval = 1)

fromMonth = input(defval=1, title = “from Month”, minval = 1)

fromYear = input(defval=2014, title = “from Year”, minval = 1)

toDay = input(defval=1, title = “to Day”, minval = 1)

toMonth = input(defval=1, title = “to Month”, minval = 1)

toYear = input(defval=2025, title = “to Year”, minval = 1)

// definitions

short = sma(close,20) // 20 day simple moving avg of close price

long = sma(close,50) // 20 day simple moving avg of close price

// logic

timeinRange1 = time > timestamp(fromYear,fromMonth,fromDay,00,00) and time < timestamp(toYear,toMonth,toDay,23 , 59)

longSignal1 = crossover(short,long) and timeinRange1

shortSignal1 = crossover(long,short) and timeinRange1

// positions

strategy.entry(id = “longPosition”, long = true, when = longSignal1)

strategy.entry(id = “shortPosition”,long = false,when = shortSignal1)

// 2nd time range stretch it out 1 year, 6 months from inital from and to ranges

timeinRange2 = time > timestamp(fromYear,fromMonth-6,fromDay,00,00) and time < timestamp(toYear,toMonth+6,toDay,23 , 59)

longSignal2 = crossover(short,long) and timeinRange2

shortSignal2 = crossover(long,short) and timeinRange2

// positions

strategy.entry(id = “longPosition”, long = true, when = longSignal2)

strategy.entry(id = “shortPosition”,long = false,when = shortSignal2)

1010 % Net profit can be true, To good to be true date from sep2017 to aug 2020.
Fun to play with any how, and thanks for giving me this knowledge Filip! Whey good training…

Buy and hold 29%, SMA + MFI strategy 40%

Timeframe #1

Buy and hold 42%, SMA + MFI Strategy 57%
Timeframe #2

//@version=4

strategy(title=“Moving Average Crossing”, overlay=true, initial_capital=5000, commission_type=strategy.commission.percent, commission_value=0.2)

//DATA AND TIME
fromMonth = input(defval=2, title =“From month”, minval=1)
fromDay = input(defval=15, title =“From day”, minval=1)
fromYear = input(defval=2020, title =“From year”, minval=1)

toMonth = input(defval=6, title =“To month”, minval=1)
toDay = input(defval=15, title =“To day”, minval=1)
toYear = input(defval=2020, title =“To year”, minval=2014)

// DEFINITIONS
shortMa = sma(close, 7)
longMa = sma(close, 27)
mfi = mfi(close, 3)

//LOGIC
timeInRange = (time > timestamp(fromYear, fromMonth, fromDay, 00, 00)) and (time < timestamp(toYear, toMonth, toDay, 23, 59))
longSignal = crossover(shortMa, longMa) and timeInRange and mfi<40
shortSignal = crossover(longMa, shortMa) and timeInRange and mfi>60

//POSITIONS
strategy.entry(id=“longposition”, long=true, qty=5000, when=longSignal)
strategy.entry(id=“shortposition”, long=false, qty=5000, when=shortSignal)Preformatted text

Despite the increase in the balance, better than buy and hold, still the Profit Factor is way too low… any advise or suggestion, it seems I am doing something wrong. cheers. @filip

I myself will come back to this part, I have worked on a longer MA so I can maximise my profits, I will now test it and upload when I am ready, mean while I will continue to learn more.
so much to learn

1 Like

//definitions
shortMa = sma(close, 20)
longMa = sma(close, 50)
r = rsi(close, 14)

//logic
timeInRange = (time > timestamp(fromYear, fromMonth, fromDay, 00, 00)) and (time < timestamp(toYear, toMonth, toDay, 23, 59))
longSignal = timeInRange and r < 32
shortSignal = timeInRange and r > 68

//positions
strategy.entry(id=“longPosition”, long=true, qty=0.5, when=longSignal)
strategy.entry(id=“shortPosition”, long=false, qty=0.1, when=shortSignal)


type or paste code here