
-
MACD is a moving average that is used to judge the overall trend of the market.
-
RSI gives an idea of whether an asset is overbought or oversold, while MACD is more of trend.
-
OBV allows you to get an idea of what the trend in volume is.
1 Like
-
MACD (Moving Average Convergence Divergence) is an oscillating trend indicator that shows the relationship between two exponential moving averages. It is used to identify momentum and understand the potential change in a trend on the market.
-
RSI (Relative Strength Index) is also a oscillating indicator. It calculates average price gains and losses over a given period of time with a movement contained in a range between 0 and 100. It’s different in the sense that it helps understand if a security is “oversold” (when the indicator on the histogram below 30) or “overbought” (when the indicator is above 70).
-
OBV (On-Balance Volume) is used to confirm a trend. It takes volume information and compiles it into a single one-line indicator which indicates buying or selling pressure. Ideally the volume should confirm price trends by following OBV trend (OBV rising should be followed by rising price and vice-versa).
1 Like
-
Moving Average Convergence Divergence is used by looking which side of 0 the lines are on
of it is above zero for a sustained period of time, and the trend is likely up; below zero for a sustained period of time, and the trend is likely down. -
MACD is focuse on trends
RSI is focused on corrections or rebounce -
OBV The indicator measures cumulative buying/selling pressure by adding the volume on up days and subtracting volume on down days.
Ideally, the volume should confirm trends
1 Like
- MACD is oscilating indicator fluctuating above and below zero. It’s used to indicate weather trend is likely to go up, or down.
- MACD is indicator fluctuating above and below zero, RSI is indicator fluctuating between 0 and 100.
- It’s indicator that measures cumulative buying/selling pressure by adding the volume on up days and subtracting volume on down days. It’s used to confirm trends .A rising price should be accompanied by a rising OBV; a falling price should be accompanied by a falling OBV.
1 Like
-
MACD stands for moving average convergence divergence. It shows if the asset price is diverging or converging to the moving average. It is given by the long term moving average subtracting the shorter one. If the long term moving average is higher than the short term it means that the price of the asset is trading downwards. It is used to see what the trend is and when the line crosses zero it can be a by or sell signal.
-
the MACD shows the trend and moves around 0. RSI shows it the assed is overbougth or oversold and is oscillating between 0 and 100.
-
OBV compiles a lot of signals concerned with the volume. It shows the strenght behind the up and downtrend. It adds the volume on downtrends and subtracts the volume on down days.
1 Like
Note: it seems that the video in the document is no longer working. At least I couldn’t watch it.
- It’s an oscillating indicator above and below a zero-line. If it goes above, it`s a a trend-up sign if it goes below the opposite
- MACD indicates a trend. RSI indicates if the market is overbought (70 and above) or oversold (30 and below)
- OBV takes indicators of volume info and puts it into a single line indicator. It’s a measure of buying or selling pressure.
1 Like
-
What is MACD and how is it used?
MAC-D has 2 lines; one fast and one slow. These are trend following mementum indicators. Buy signal occurs when fast line crosses slow line and Sell signal is when slow line crosses fast line. Lines crossing show a good indication that the trending is accelerating. -
What is the difference between MACD and RSI?
MAC-D is based on trending lines crossing and gaining momentum that indicates the market is moving up or down; not ranging.
RSI is not as accurate as MAC-D but “occasionally” helps indicate overbought/oversold up/down trends.Overbought shows trading is above the assets value and oversold indicates asset is trading below it value.
- What is OBV and how is it used? OBV (On Balance Volume ) Takes a lot of Volume into a 1-Line Indicator. This line shows the Volume Trends. OBV used to project when major moves in the markets would occur based on volume changes. OBV focuses on Volume not price so price may change but OBV’s focus is not the moment to moment Volume that creating the moving liine.
1 Like
- The MACD is an oscillating indicator on a 0 line which can follow trend or momentum, it also has 2 lines fast and slow to help determine buy or sell. Buy signal when fast line crosses above 0 or slow line. Sell occurs when fast line goes below 0 or slow line .
- The difference between MACD and RSI is, The RSI is an oversold or overbought indicator and has 0-100 oscillator for different info. compared to MACD which has a trend line at 0 to indicate movements above or below that line.
- It takes volume of moving pressure on a single line indicator by adding on up days and subtracting on down days.
1 Like
-
MACD is used to measure the price momentum and it fluctuates above and below on indicators.
-
MACD measures momentum and RSI measures if price is over bought or over sold.
-
OBV is used to measure the buying and selling pressure. Its great for confirming trends
1 Like
1. What is MACD and how is it used?
MACD stands for Moving Average Convergence Divergence. This indicator is an oscillator and can be used to identify trend reversals in the market.
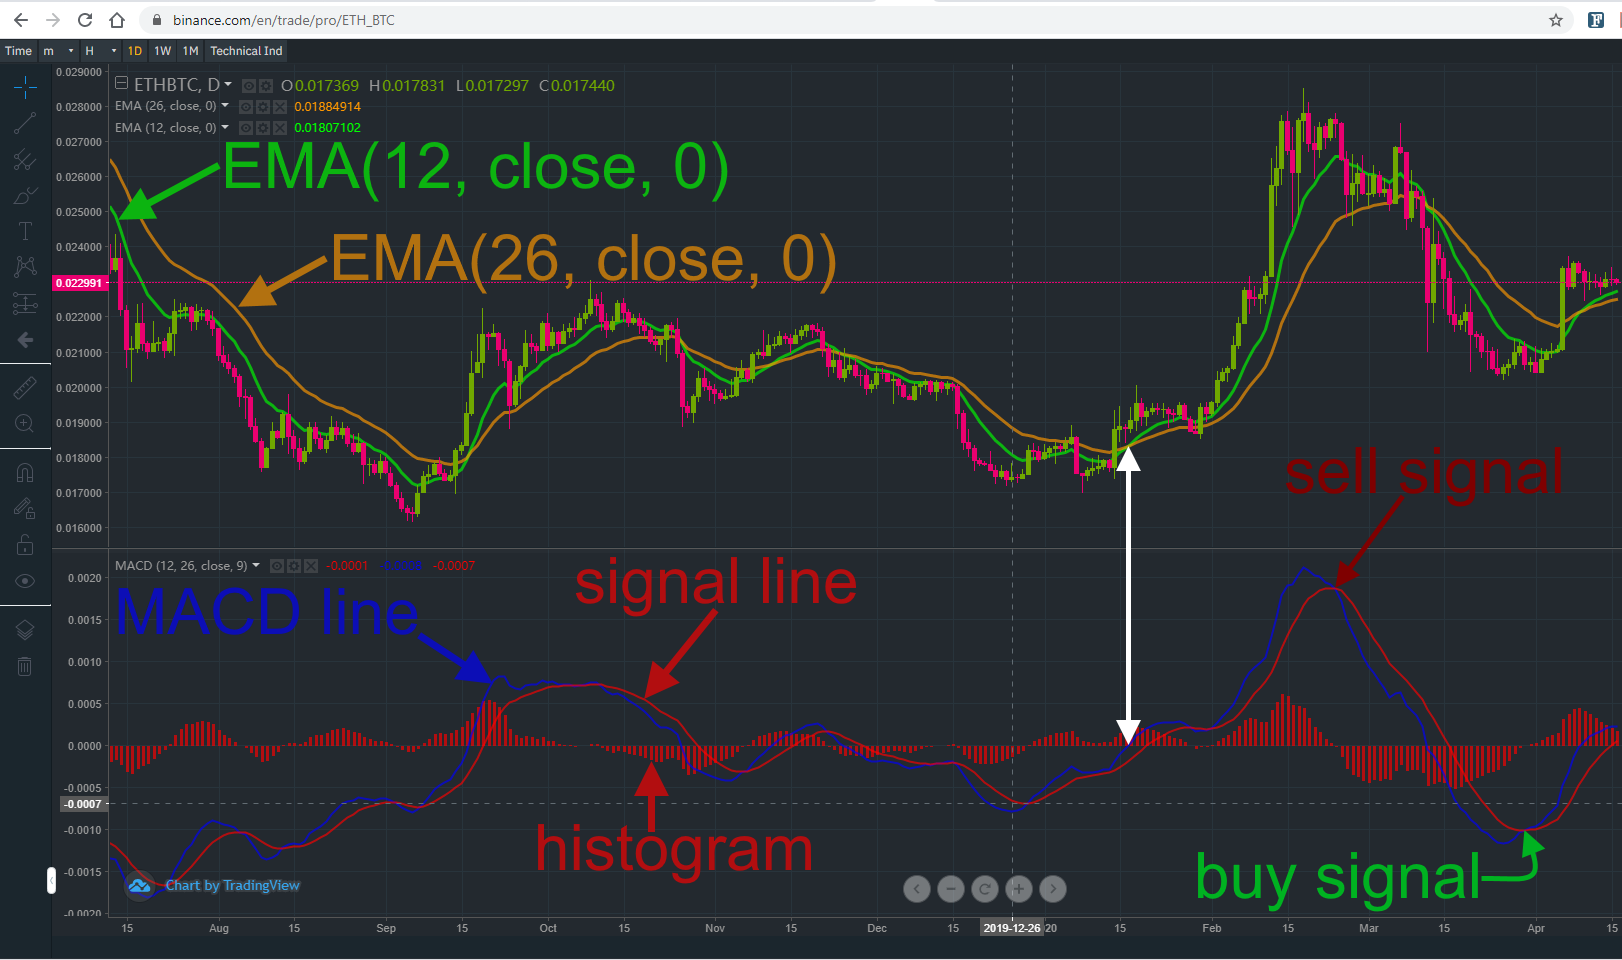
In this example I will describe in detail how the MACD(12, 26, close, 6) on the daily time frame is calculated. First of all you will need two Exponential Moving Averages with different time frames:
- Green line: Fast Length 12-interval EMA
- Orange line: Slow Lenght 26-interval EMA
The blue MACD line is calculated by subtracting the 26-interval EMA from the 12-interval EMA. Since the blue MACD line is the difference between these two EMAs it always crosses the zero line, when the EMAs cross each other as is shown by the white arrows. The red signal line is calulated by taking the 9-interval EMA of the MACD line. This is also the reason why the signal line looks smoother than the MACD line. When the MACD line crosses below the signal line this is considered as a bearish signal. When the
MACD line is crossing above the signal line this is considered as a bullish signal. The histogram is a visual representation of the distance between the MACD line and the signal line. If the MACD line is above the signal line the histogram bars are pointing above the zero line. If the MACD line is below the signal line the histogram bars pointing below the zero line. The length of this histogram bars are a sign for the strength of the trend. Bars pointing to the upside show a bullish and bars pointing to the downside show a bearish trend. Another reason why these bars are useful is the fact that a crossing of the MACD line and the signal is imminent when the bars are getting smaller and smaller. This means that a trader will get the information about a possible trend reversal in advance.
2. What is the difference between MACD and RSI?
The RSI stands for Relative Strength Index and it is also an oscillator. The RSI has only one parameter which is the number of time intervals. The RSI is calculated in the following way:
RSI Calculation Formula
- RSI = 100 – 100 / ( 1 + RS )
- RS = Relative Strength = AvgU / AvgD.
- AvgU = average of all up moves in the last N price bars.
- AvgD = average of all down moves in the last N price bars.
- N = the period of RSI.
The RSI can move in the range betweeen 0 and 100.
An RSI below 30 is considered as an oversold market and can be used as a buy signal.
An RSI above 70 is considered as an overbought market and can be used as a sell signal.
3. What is OBV and how is it used?
On-Balance Volume (OBV) itself is a valuable indicator, and OBV takes a lot of volume information and compiles it into a single one-line indicator. The indicator measures cumulative buying/selling pressure by adding the volume on up days and subtracting volume on down days:
Calculating OBV
- If today’s closing price is higher than yesterday’s closing price, then:
Current OBV = Previous OBV + today’s volume. - If today’s closing price is lower than yesterday’s closing price, then:
Current OBV = Previous OBV - today’s volume.
Ideally, the volume should confirm trends.
A rising price should be accompanied by a rising OBV.
A falling price should be accompanied by a falling OBV.
1 Like
-
What is MACD and how is it used?
-
What is the difference between MACD and RSI?
-
What is OBV and how is it used?
-
It’s an overall trend for a specified time period in the past. It is used to figure out weather the price is trading above or below trend and to identify probability of pull back or reversal in price.
-
RSI is used to identify if the asset is overbought or oversold.
-
OBV is used to identify the strength of the price level or trend.
- What is MACD and how is it used?
MACD is an oscillating indicator; it tracks shift in momentum and is best used for trend analysis.
- What is the difference between MACD and RSI?
MACD and RSI are both known momentum indicators; however, RSI tracks when an asset is over/under bought where MACD tracks whether a trend is up or down.
- What is OBV and how is it used?
OBV uses volume and price to determine negative/positive selling pressure.
1 Like
-
Moving Average Convergence/Divergence is a trend following and momentum indicator. If it is below 0 for a certain amount then the trend is likely bearish and if above likely bullish. A buy signal occurs when the fast line crosses through and above the slow line. A sell signal occurs when the fast line crosses through and below the slow line. The fast line is normally the 12 MA and the slow line the 26 MA.
-
The RSI - relative strength index is between 0 and 100 and is an indicator if something is overbought (above 70) and due for a correction or oversold (below 30) and likely to rise again.
-
OBV - On-Balance Volume is a single line indicator that measures cumulative buying/selling pressure. It should ideally rise in an uptrend.
1 Like
What is MACD and how is it used?
Moving Average Convergence Divergence. It is a fluctuating indicator which fluctuated above and below 0. It shows the current trend and momentum.
What is the difference between MACD and RSI?
RSI - indicates of overbought or oversold market.
MACD - indicates the overall strength and trend of the market.
What is OBV and how is it used?
On-Balance Volume. It is used for measuring the cumulative buying/selling pressure.
1 Like
[quote=“filip, post:1, topic:7682”]
-
hat is MACD and how is it used?
Moving Average Convergence Divergence ( MACD ) is a trend-following momentum indicator that shows the relationship between two moving averages of a security’s price. The MACD is calculated by subtracting the 26-period Exponential Moving Average (EMA) from the 12-period EMA -
What is the difference between MACD and RSI?
MACD measures the relationship between two EMAs, while the RSI measures price change in relation to recent price highs and lows -
What is OBV and how is it used?
On-balance volume (OBV) is a technical trading momentum indicator that uses volume flow to predict changes in stock price. Joseph Granville first developed the OBV metric in the 1963 book Granville’s New Key to Stock Market Profits .
Granville believed that volume was the key force behind markets and designed OBV to project when major moves in the markets would occur based on volume changes. In his book, he described the predictions generated by OBV as “a spring being wound tightly.” He believed that when volume increases sharply without a significant change in the stock’s price, the price will eventually jump upward or fall downward.
1 Like
Moving Average Convergence Divergence.
Trend following momentum indicator. Reading from the angle, crosses, use as support and resistance, provides additional buy and sell signals.
RSI’s movement is contained between zero and 100, while MACD fluctuating above and below zero.
They providing different information.
On Balanced Volume takes a lot of volume information and compiles it into a single one-line indicator.
Measures cumulative buying/selling pressure by adjusting the volume.
Ideally, the volume should confirm trends.
1 Like
-
What is MACD and how is it used?
The MACD is an oscillating indicator, fluctuating above and below zero. It is both a trend-
following and momentum indicator. Above zero for a sustained period of time, and the
trend is likely up; below zero for a sustained period of time, and the trend is likely down.
Potential buy signals occur when the MACD moves above zero, and potential sell signals
when it crosses below zero. -
What is the difference between MACD and RSI?
RSI movement is contained between zero and 100, it provides some different information
than the MACD witch moves above and under the zero level. -
What is OBV and how is it used?
On Balance Volumes takes a lot of volume information and compiles it into a single one-
line indicator. The indicator measures cumulative buying/selling pressure by adding the
volume on up days and subtracting volume on down days.
1 Like
-
The Moving Average Convergence/Divergence (MACD) is the difference between two moving averages. The short term average moves more closely to the price and when it crosses over the longer term the MACD forms a zero crossing that is used as a buy/sell indicator. When the short term crosses the long term on a positive slope that is considered a buy signal and conversely when the short term crosses the long term on a negative slope that is considered a sell signal.
-
The Relative Strength Index (RSI) is a ratio between the average up sessions and average down sessions over a fixed period. RSI is typically used to indicate overbought/oversold conditions where as the MACD is used as a trend-following and momentum indicator.
-
On-Balance Volume (OBV) is a volume based indicator that adds up the volume on up sessions and subtracts the volume on down sessions. It is used as a trend confirming indicator.
1 Like
-
What is MACD and how is it used?
MACD = Moving Average Convergence/Divergence is used to track bullish/bearish momentum, by comparing the fast line (12 MA) against the slow line (26 MA), with 0 as the index value, if above 0 then bullish, if below 0 then bearish. -
What is the difference between MACD and RSI?
RSI (Relative Strength Index) is another index to measure essentially the “buying temperature”, measuring from 0 to 100, and roughly signaling an overbought sentiment above 70 and “oversold” sentiment under 30. -
What is OBV and how is it used?
OBV (On Balance Volume) is important to help judge and support the validity of trends and momentum shifts, such as if there’s an upward trend and volume is flattening or dipping, it indicates that the price is reaching a top.
1 Like
- What is MACD and how is it used?
(Moving Average Convergence Divergence) is used to identify possible trends in the market.
Identify points in price charts.
Use as buy/sell signals.
Contains 2 moving averages fast/slow
- What is the difference between MACD and RSI?
(Moving Average Convergence Divergence) indicates the averages above and below 0 while RSI( Relative Strength Index)* indicates if the value is overbought/oversold on a chart between 0/100.*
- What is OBV and how is it used?
(On Balance Volume)
Volume indicator.
Measures the Buy/Sell Pressure.
Volumes confirms Trends.